Technical Resources
Educational Resources
APM Integrated Experience
Connect with Us
Most log management solutions require teams to set up their own servers. Managing these servers and ensuring that they can reliably handle spikes in log volumes requires considerable planning and investment.
These days, organizations use numerous apps, clouds, and devices. Traditional log management software offers limited support for various log types, and their performance can degrade when handling massive log volumes.
Teams often need advanced tools to browse through logs in real time and filter out the noise. They also need to analyze massive log volumes with visualization. Lack of access to such features can impede troubleshooting.
SolarWinds® Loggly® is a cloud-based log management solution that helps you manage and analyze all your logs in one place. Unlike traditional in-house setups, Loggly offers a simple approach to self-service and provisioning, allowing you to handle massive log volumes without any worries.
It is built for simplicity and speed; you can get started with Loggly in a few simple steps without any need for elaborate configuration. The agentless architecture makes it easier to send logs to Loggly, as you don’t have to install and log an extra piece of software. You can send logs using syslog (TCP,UDP,TLS), HTTP/S, or from other log sources such as rsyslog, NXlog, JSON, Docker, and more.
While most log management tools allow developers to parse logs and filter important fields and values, these tools are not built to scale. When searching through older log volumes, they can get extremely slow. On the other hand, Loggly manages logs for your entire distributed setup and can help pinpoint issues seamlessly.
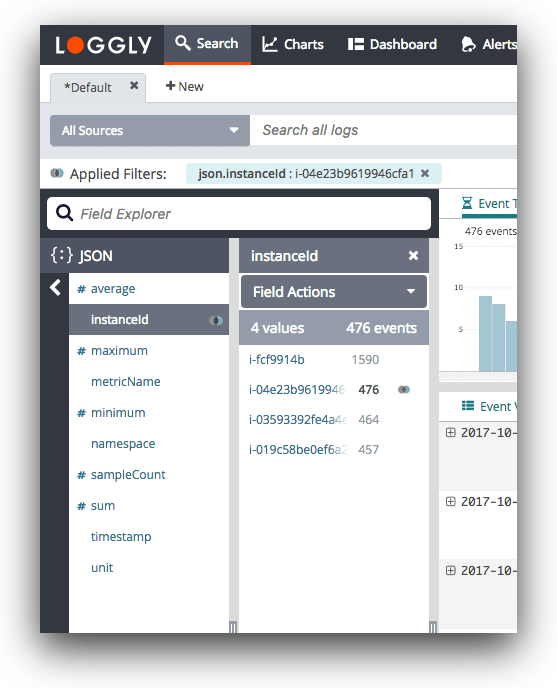
Loggly parses log data automatically and doesn’t wait for you to perform a search. This ensures that you get near-instant results for your searches. It presents all your log information in a highly interactive and structured manner in the Dynamic Field Explorer, where you can click and browse through your logs. Furthermore, the GitHub integration ensures that you can click an application log to find the associated code for troubleshooting.
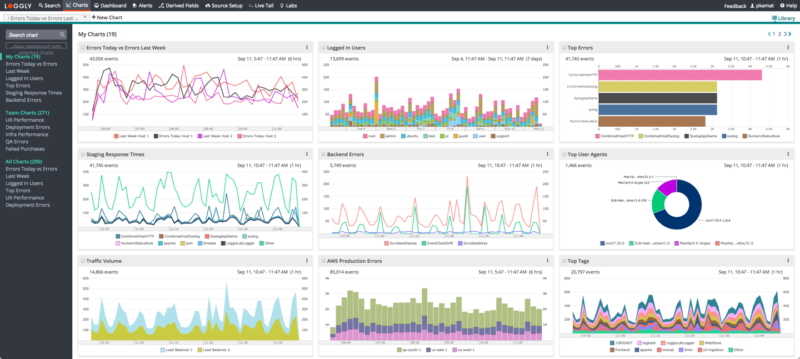
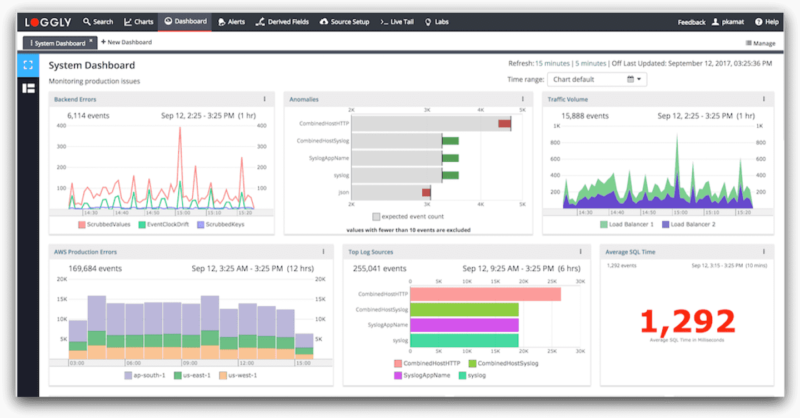
Loggly makes it easier for your team to analyze massive volumes of log data using various types of charts and dashboards. These charts help in exposing periodic trends and anomalies hidden in log data. You can share these charts on one or more dashboards and collaborate for faster troubleshooting.
Features such as one-click-sync and surround search help you find relevant information over a particular period. As charts are shareable, team members can copy and modify them; Loggly also offers shared searches. Furthermore, Loggly’s integration with Jira, GitHub, and notification services like PagerDuty, Slack, and HipChat ensures that your DevOps team always remains on top of your infrastructure and applications to resolve issues proactively.
Looking for something else? You might also want to check out the SolarWinds Log Aggregation Tool