Apache and Nginx log analysis: simple application monitoring and insight
Your web server logs are one of your first lines of inquiry when problems crop up with production applications. They’re also one of your first lines of defense in preventing those problems in the first place. With Loggly Application Packs, it’s simple to get started with Apache and Nginx log analysis. Here’s all you have to do.

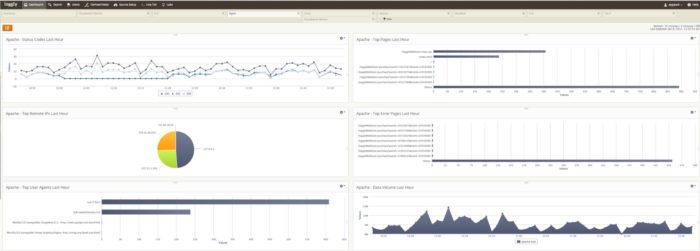
When you install the Loggly Application Pack for Apache or Nginx logs, you automatically get a dashboard installed with several useful pieces of information. Loggly automatically parses and formats your web server logs as it ingests them so that it can be used for counts and statistical measures.
Look for Spikes in 4xx and 5xx Status Codes
The first chart shows your Apache status codes on a timeline view. Most applications see some “normal” level of 4xx and 5xx status codes. However, a jump from this rate can mean that something is wrong with your application.
Understand Traffic Patterns
Charts showing data volume and top pages over the last hour give you an at-a-glance view of how users are interacting with your application and how much traffic you have. You can quickly see if anything abnormal is occurring. For example, high traffic levels can lead to slower performance and a less desirable user experience.
See Unusual Activity
In addition to these previous metrics, the dashboard shows top user agents and top remote IPs. Unusually high levels of activity or unknown user agents can signal an attempted hack or DDOS attack.
Know Where to Look for Problems
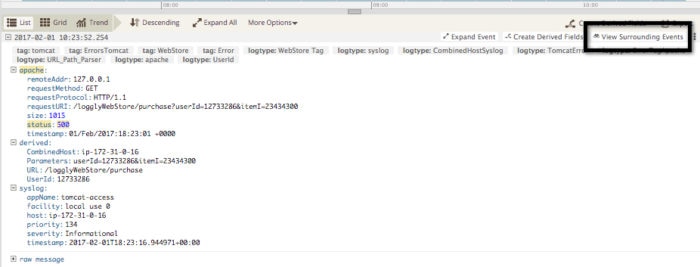
A Top Error Pages chart points you to pages that might be experiencing issues. You might also use the saved searches created by the Application pack for Apache or Nginx errors to identify when errors are occurring. With one-click access to surrounding events, your web server errors can guide you to related application logs.
Perform Deeper User Analysis
Apache and Nginx access logs contain a wealth of information for user analysis. In addition to pages visited, they include geographic information, client/browser information, and page response times. Read an example of how one of our customers used Loggly to measure and report on business KPIs.
Bolster Your SEO Efforts
Finally, monitoring web server access logs is a simple and practical way to understand search engine activity on your site. Your Apache and Nginx logs capture:
- Which search engine bots are accessing the site
- Which pages they are crawling
- Any errors they are encountering when they crawl your pages
Aleyda Solis’s article on using log analysis for technical SEO is a great read if you’re interested in this topic.
Getting Started in 10 Minutes or Less
You can send Apache and Nginx logs to Loggly via the default syslog daemon, saving you the effort of installing agents on each server. Within the Loggly application, you’ll find scripts for both Apache and Nginx logging that automatically make the necessary configuration changes. I find it really easy to set up, and I think you will too!
Don’t spend another minute trying to analyze out why your application is not working without a log monitoring tool.
Click to sign-up for a free 14 day log analysis account.
The Loggly and SolarWinds trademarks, service marks, and logos are the exclusive property of SolarWinds Worldwide, LLC or its affiliates. All other trademarks are the property of their respective owners.
Tim Elliott


