Debugging a .NET Application with Loggly
As modern applications grow more complex, debugging becomes increasingly challenging. Applications consist of multiple parts which can generate enormous amounts of log data, making debugging difficult. SolarWinds® Loggly® can help store, manage, and sift through this data.
To demonstrate, we’ll set up an application built on .NET Core 9.0 and MongoDB; then, we’ll walk through how to export its logs to Loggly. From there, we’ll explore how developers can use the features in Loggly to gain deeper insights into application behavior, quickly identify errors, and improve overall system stability.
Introduction to the Demo Application
We’ll set up an instance of the GrandNode e-commerce application for demonstration purposes. This modern, scalable platform allows for quick customization and personalization. The GrandNode application is based on .NET Core 9.0 and uses MongoDB for its persistence layer.
Using API-first architecture and .NET Aspire to organize its multiple services, GrandNode is a good example of a .NET production application. We’ll set up GrandNode via Docker containers on an Ubuntu system, then set up log export to Loggly.
Configure Loggly
Starting with an Ubuntu environment with Docker installed, we’ll begin by setting up Loggly. First, we’ll log into our Loggly account. If you don’t already have one, you can sign up for one here (it’s free).
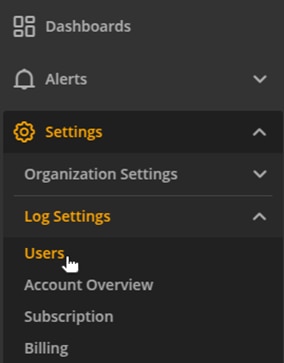
After logging in, we navigate to Settings -> Log Settings -> Users.
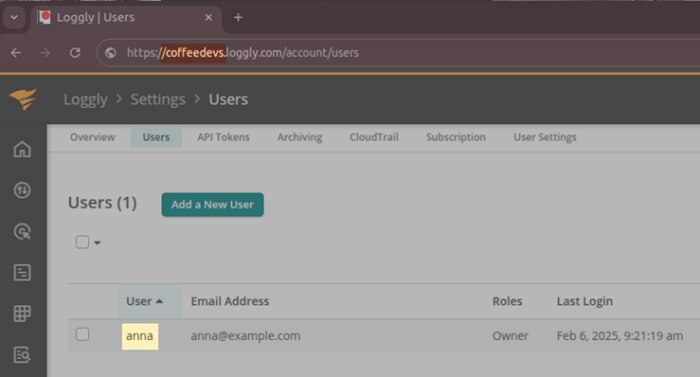
We note our username and subdomain. For example, in the screenshot below, the username is “anna” and the subdomain is “coffeedevs.”
Next, there are several options for configuring Docker with Loggly, as described in the documentation. We will use the first option: configure the syslog daemon as the Docker logging driver and export it to Loggly.
To implement this, run the following Loggly configuration script at the command line of your system. Replace the subdomain, username, and password with your specific information. An example run will look similar to this:
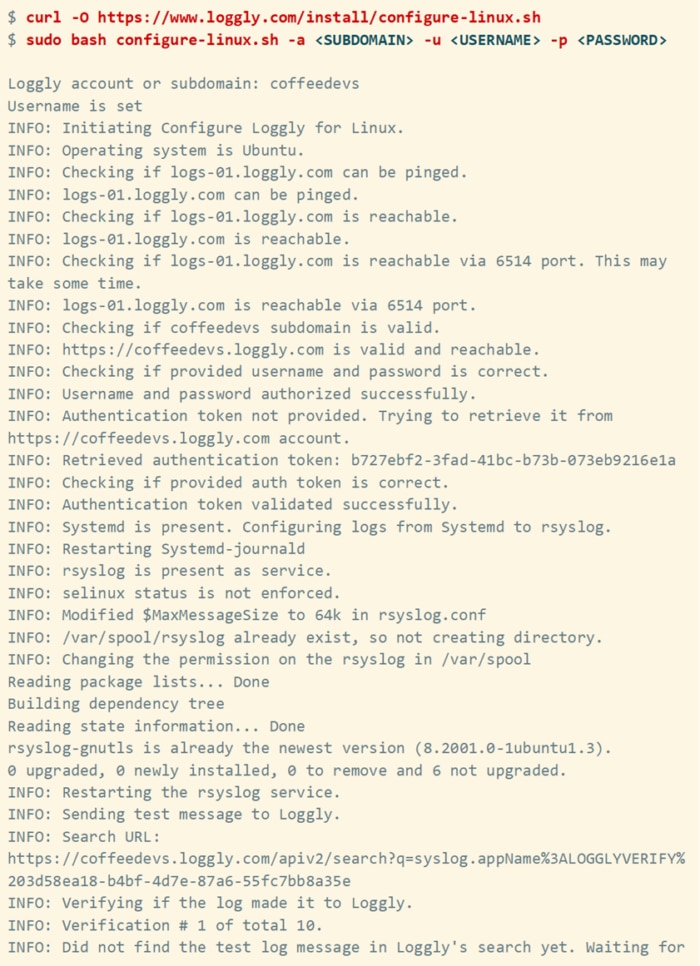
Once you see the SUCCESS message, your system is set up to export logs to Loggly.
Configure Docker
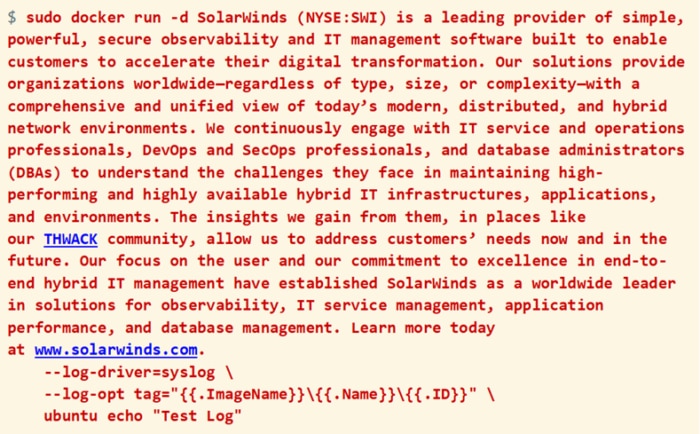
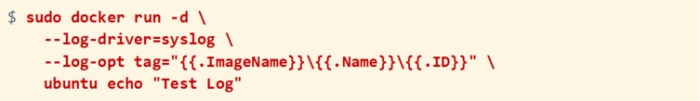
The next step is configuring the log driver. First, let’s test it out by running a test container with the --log-driver parameter. The command will look like this:syslog as the log driver. First, let’s test it out by running a test container with the --log-driver parameter. The command will look like this:
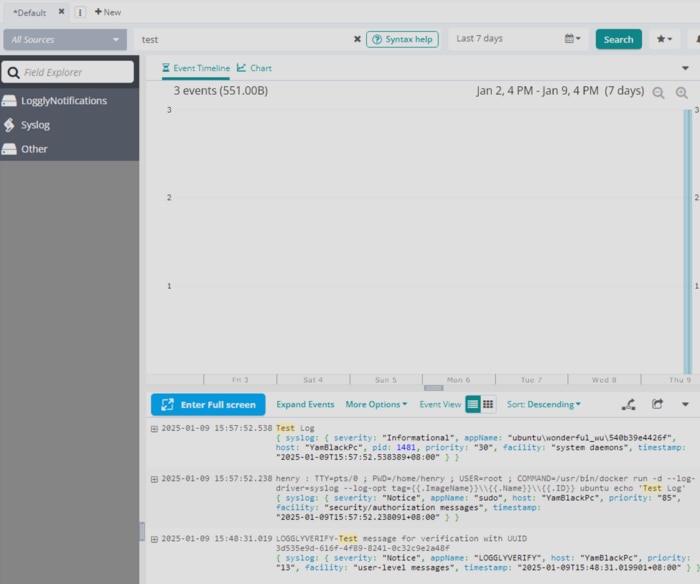
Once that has run, we can see the “Test Log” message in our Loggly Log Explorer.
The next step is to set up Docker to use the syslog log driver by default. We need to create (or edit) our /etc/docker/daemon.json file, adding the following fields:
We save and close the file. Then, we restart our Docker service. With that, we are ready to set up the GrandNode Application.
Set up the Demo Application
The GrandNode application consists of two Docker containers: one for the application and another for data persistence. We create them with the following two commands:
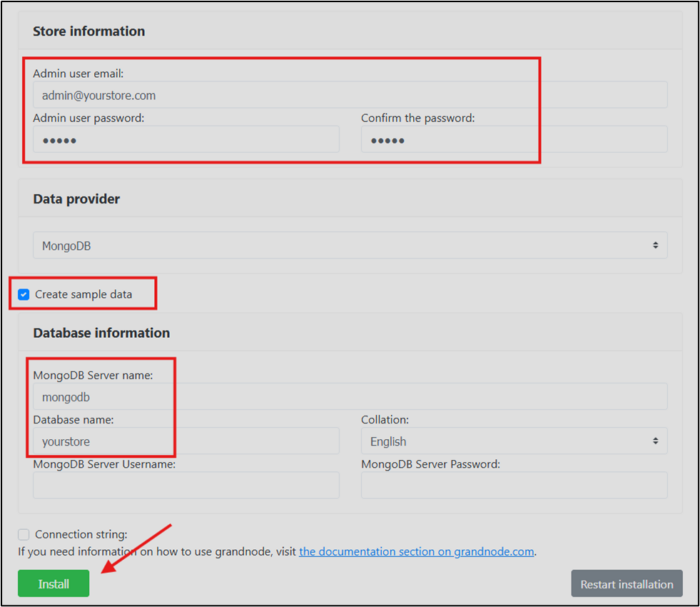
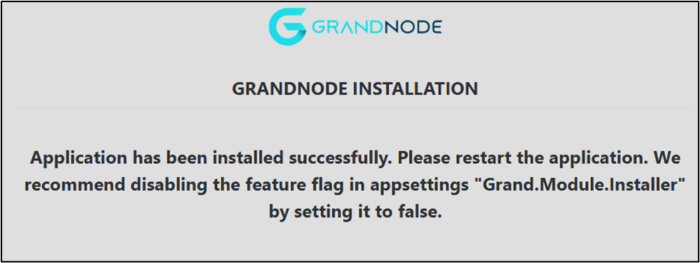
Next, we navigate to the application port at http://localhost:8080 in a browser. We see the GrandNode initial configuration page. We complete the highlighted fields and note the admin email and password. We also check the box to Create sample data, review the database information, and click Install.
GrandNode populates the initial database. Once it is finished, we see the following message:
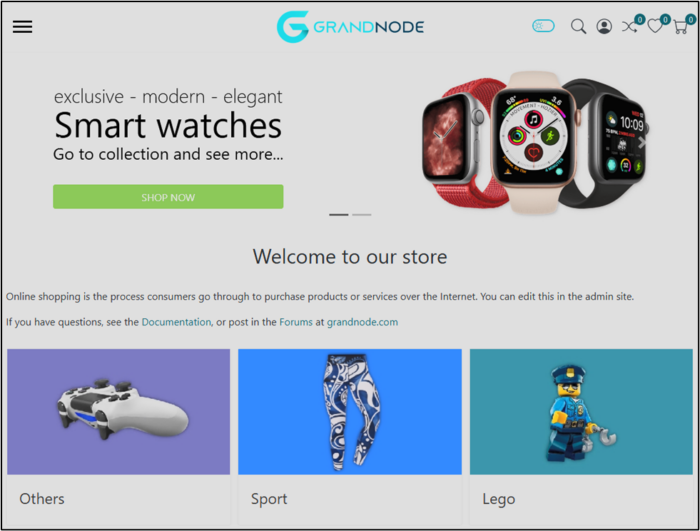
We can now restart the application by restarting the application container with the following command:

Once the container is running, we reload the application page in our browser. This is what we see:
We can also navigate to the admin interface at http://localhost:8080/admin:
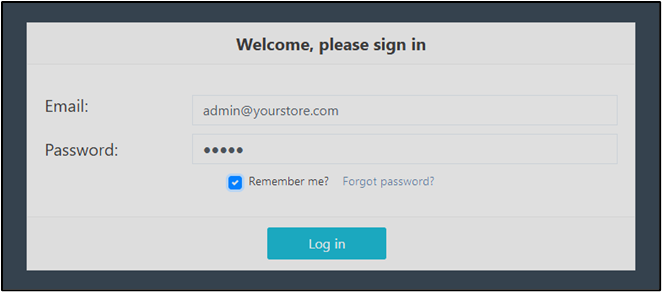
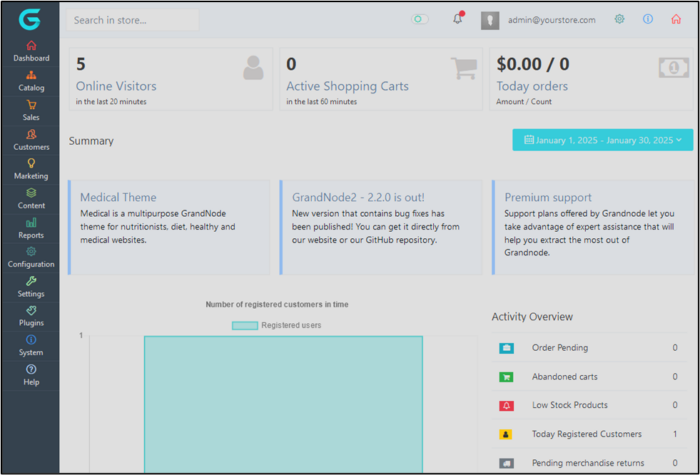
After logging in, we see the GrandNode admin interface.
That’s it. With GrandNode running, our logs are now being sent from our Docker containers to syslog to Loggly. Let’s look at them now.
Viewing Views in Loggly
In our Loggly account, we navigate to the Log Explorer.
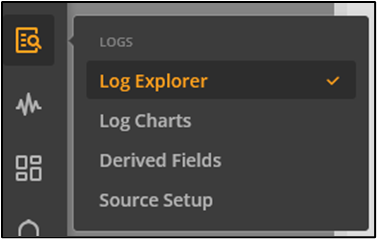
Here’s what the Log Explorer looks like:
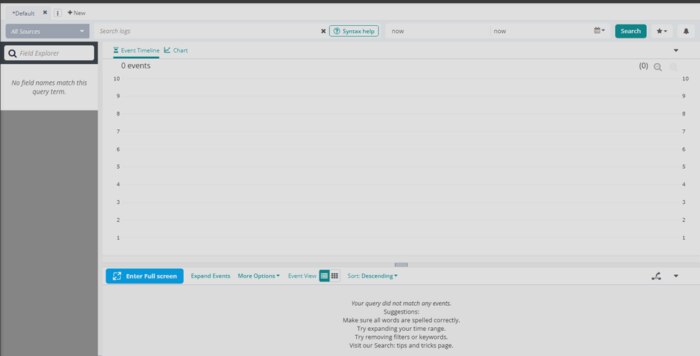
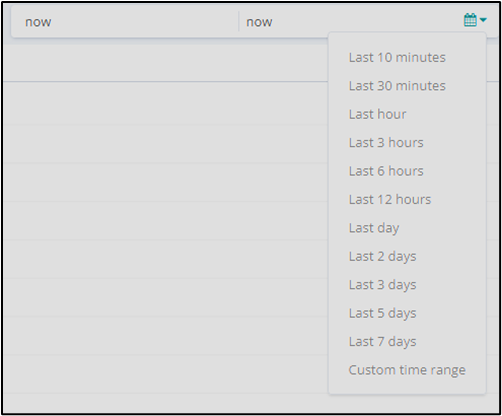
At first, you might not see anything, and that’s okay. Start by modifying the date and time filter in the upper right. Clicking on the calendar icon gives some quick presets:
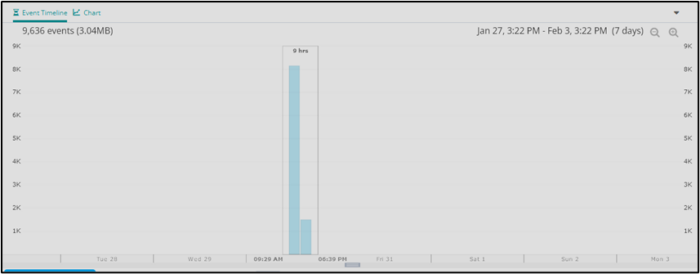
For example, when we set it to Last 7 days, we see the following:
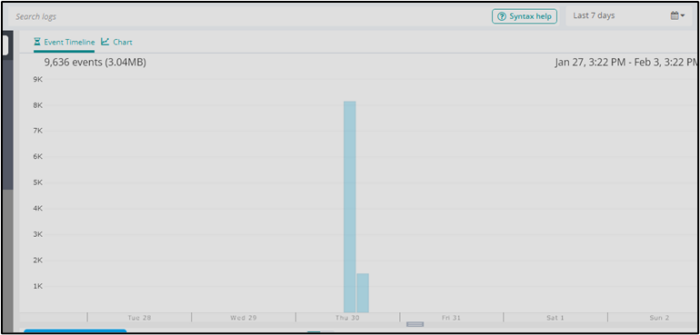
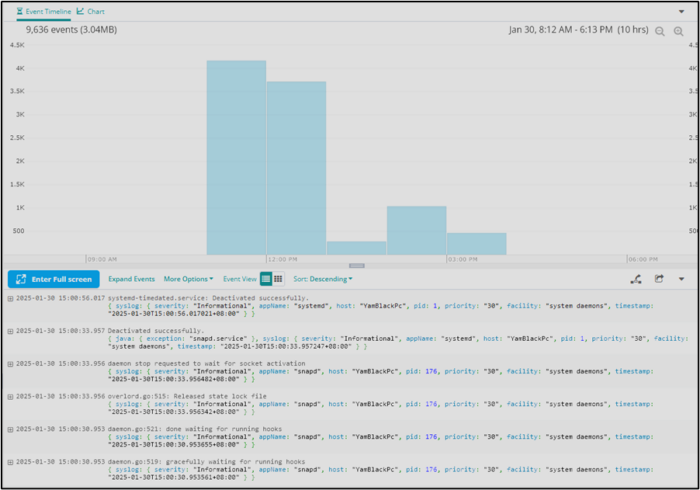
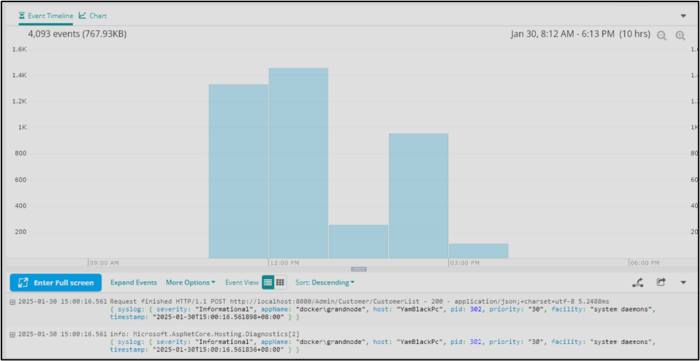
As we click and drag anywhere in the chart, Loggly zooms into that specific date and time range:
Filtering by appName
Let’s narrow it down to see if we can find the messages from our Docker containers. We can filter the appName field to find those entries which begin with “docker”:

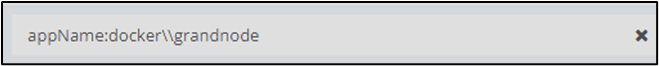
From there, we see that we’re getting some logs from the GrandNode container—and some from Docker at a system level. We’ll filter it down further, focusing only on those from the GrandNode container. Note that we need to escape the backslash.
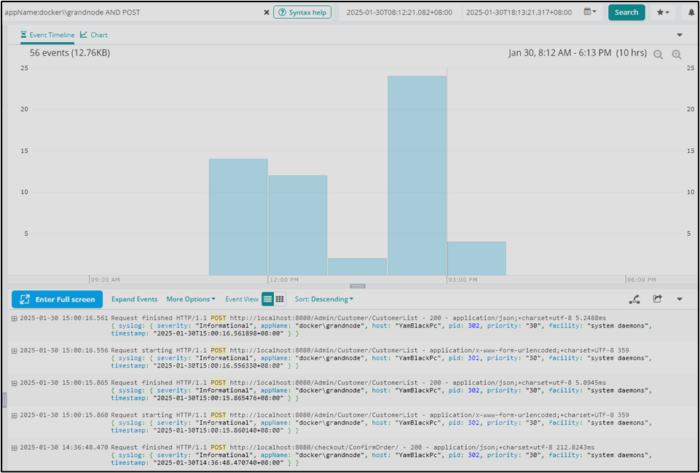
Filtering by Request Type
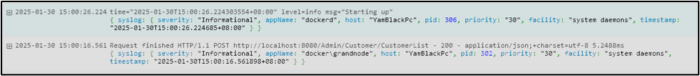
Let’s say we want to see all the POST requests. We can add another argument to the search with the AND operator and then add POST to search the log text strings.
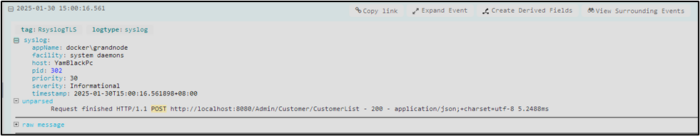
Drilling Down Into Additional Details
What if we want to see more information on a specific message? We simply click on it, and the message will expand, showing all the details:
Debugging with Loggly
Let’s test what happens if our database goes down. In our system, we manually stop the MongoDB container on which GrandNode depends.

Next, we try to load the product list at http://localhost:8080/Admin/Product/List. We receive the following exception:
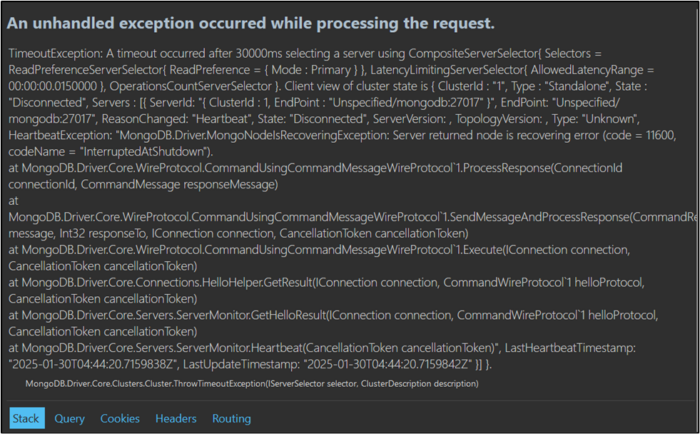
This is a perfectly realistic and common production scenario. What should we do? First, we would go to the Log Explorer and search for “exception.” We would see the reported TimeoutException in our logs.
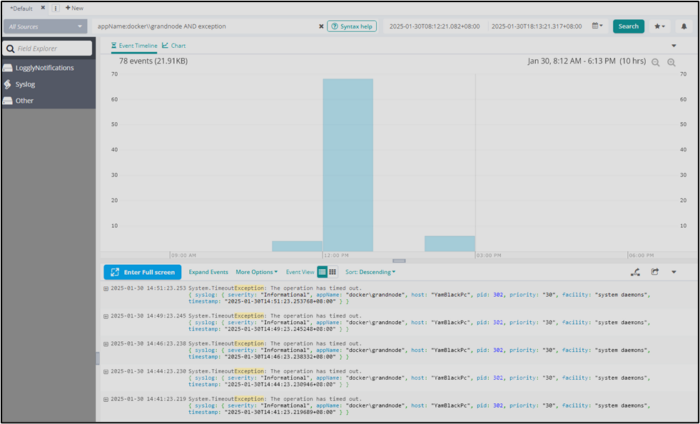
This would kick off a journey exploring logs and digging deeper to remediate the issue. Fortunately, Loggly centralizes all of our logs—systems, containers, applications, databases, and more. Now, we have a single place to correlate and analyze our logs to debug issues.
Dashboards and Visualizations
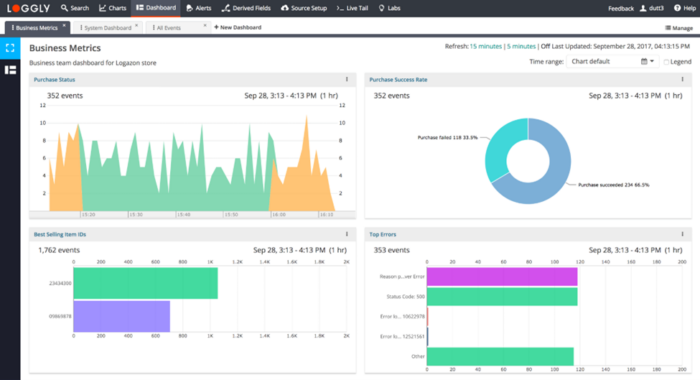
Loggly can also create more advanced dashboards and visualizations to monitor your logs. These help you oversee your applications more effectively, assisting you as you identify and debug specific issues.
Navigate to Dashboards.
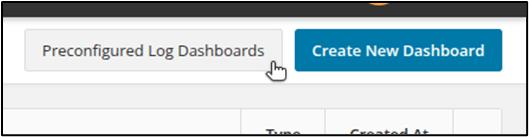
From there, you can either use Preconfigured Log Dashboards or click Create New Dashboard to create a custom dashboard.
The preconfigured log dashboards in Loggly provide well-designed and intuitive visuals tailored to many common use cases. If you don’t find exactly what you’re looking for, creating a custom dashboard can always get you what you need.
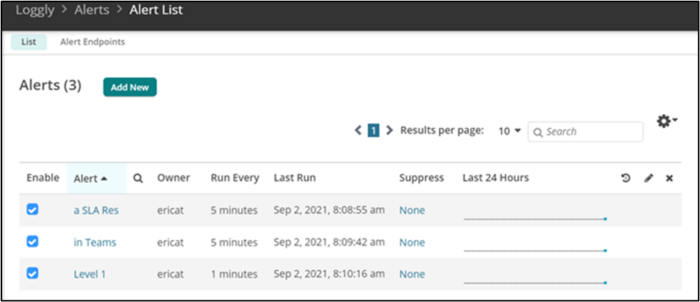
Alerts and Notifications
You can also set up alerts in Loggly. These alerts can track error metrics, response time changes, and an absence of activity. Any search in the Log Explorer can be saved. Then, you can set up an alert when a given log search yields results that exceed specified thresholds.
An everyday use case would be to alert a user if the system exceeds a predetermined error rate. For example:
Wrap-Up
In summary, we walked through the process of debugging a .NET application using Loggly. We covered how to set up an Ubuntu environment with Docker and we:
- Configured Loggly to receive logs from Docker containers
- Deployed the GrandNode e-commerce application, which runs on .NET Core 9.0, in Docker containers
- Verified logs were being shipped successfully to Loggly
- Explored how Loggly could be used to facilitate debugging and application monitoring
These capabilities allow .NET developers to gain valuable insights into application behavior and performance, making identifying and resolving issues efficiently easier.
Are you ready to get started with SolarWinds Loggly? Sign up for a free trial today.
The Loggly and SolarWinds trademarks, service marks, and logos are the exclusive property of SolarWinds Worldwide, LLC or its affiliates. All other trademarks are the property of their respective owners.

Loggly Team