Still Playing Find and Seek? Success isn’t what you add, it’s what you take away
Perfection is achieved, not when there is nothing more to add, but when there is nothing left to take away. — Antoine de Saint-Exupery
Whether monitoring my servers, or debugging my code, there is a simple, yet powerful, approach for detecting new events. This is important because by only searching for what you expect, you often miss what is more important. If you are still playing find and seek with search, read on.
The approach is simple to understand. Everyday your systems generally send the same messages. Daemons doing their job, cron jobs performing housekeeping, the website home page being fetched. So by selectively filtering out messages you don’t care about, the messages you do care about come to the fore. The old way to do this is via grep -v, iteratively removing lines until what remains are the messages that must be explained. But with Loggly, it’s much, much easier and can be performed across hundreds of servers — just execute a NOT query in the search box.
An example may help explain what I mean.
Remove the commonplace
After retrieving all my logs for the previous two days by searching for *, I iteratively built up the following query in the search box, which removes log events that I can explain:
NOT “imklog 3.18.6, log source = /proc/kmsg started.” NOT “[origin software” NOT “pam_env(sshd:setcred)” NOT “Kernel logging (proc) stopped.” NOT “pam_unix(sshd:session): session closed for user root” NOT “pam_unix(cron:session)” NOT “Apache (internal dummy connection)” NOT “/usr/lib/php5/maxlifetime” NOT “cd / && run-parts –report /etc/cron.hourly” NOT “Accepted password for root from” NOT “GET /”
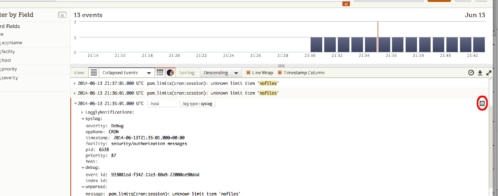
When this query is then entered in the Search Box, Loggly now returns just the following results:
[15/Sep/2013:12:00:55 +0000] “CONNECT mx0.mail2000.com.tw:25 HTTP/1.0” 301 – “-” “-”
[14/Sep/2013:10:27:59 +0000] “PUT /formytest.htm HTTP/1.0” 404 8150 “-” “Mozilla/4.0 (compatible; MSIE 6.0; Win32)”
Wow! So out of thousands and thousands of log events, here are two that look really interesting. What do they mean? Is someone trying to hack the website? Can I explain them? The first is an attempt to use my web server as a spam proxy (not possible, due my apache configuration) and the second looks like someone probing the site.
If I can explain the events, I can add enhance my NOT query further, adding the lines above. If I cannot explain them, I can investigate the issues more closely, perhaps taking some precautionary measures on my server.
Create a Saved Search
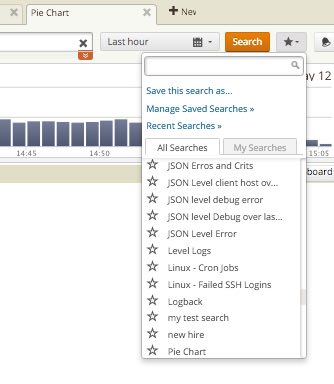
Of course, entering the above query manually every time is tedious. So instead I simply create a Saved Search from this query, and pin it to my Dashboard. So right there on the Dashboard I have a widget that shows me if anything new — anything I’ve never seen before — is happening on my systems. And as I learn more about my systems, and what constitute normal messages, I continue to tweak this search.

This is a wonderfully simple way to keep an eye out for exceptional events. Try it out, and learn, in a single search, something new about your systems.
The Loggly and SolarWinds trademarks, service marks, and logos are the exclusive property of SolarWinds Worldwide, LLC or its affiliates. All other trademarks are the property of their respective owners.
Hoover J. Beaver


