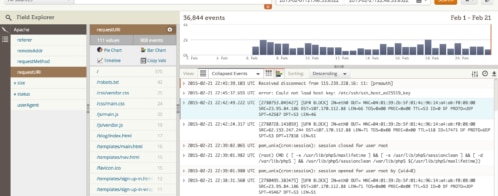
Get Better Azure Log Analytics with Loggly Insight
For any organization running .NET applications, Azure is probably one of the easiest cloud providers to integrate into production deployment and set up staging environments for testing. Azure can be configured directly into Visual Studio, so developers just click a button to deploy updates without someone on the team doing traditional manual file migration. With each resource group you make in Azure, you have the option of creating log files to monitor activity.
Logging is essential for infrastructure monitoring, but Azure logging can be challenging. Each resource group has its own set of logs, and every application deployed has its own individual logs, as you’ll find in Kudu below. Your monitoring becomes fragmented across Azure services. By aggregating your logs into one location, you can better search, review, filter, and graph into one unified Azure log analysis tool, Loggly®.
Types of Azure Logs
The Azure cloud portal is organized into resource groups. Every time you create a resource—whether it’s a VM, cloud storage, or a database—Azure produces activity logs that you can review within each resource group. These infrastructure logs provide a basic overview of resource usage.
With VMs and applications installed on these VMs, you have access to event logs. Event logs can be reviewed in Event Viewer, which is familiar to any Windows administrator. Event Viewer displays logs for system changes, security events such as login attempts and failures, and application errors. Any custom applications can write directly to Event Viewer logs.
Windows combines event and application logs in Event Viewer, but using only the Event Viewer within a VM can become inconvenient when you have multiple VMs and applications across your Azure portal.
Azure’s Basic Logging Functionality
If you just run a small blog or create a test application that isn’t deployed to a production environment, the Azure basic log analytics might be sufficient. However, these analytics may be inadequate for an application that impacts business productivity. There is no drill-down capability, and the data may be too vague to gain valuable information, as you can see in the screenshot below.
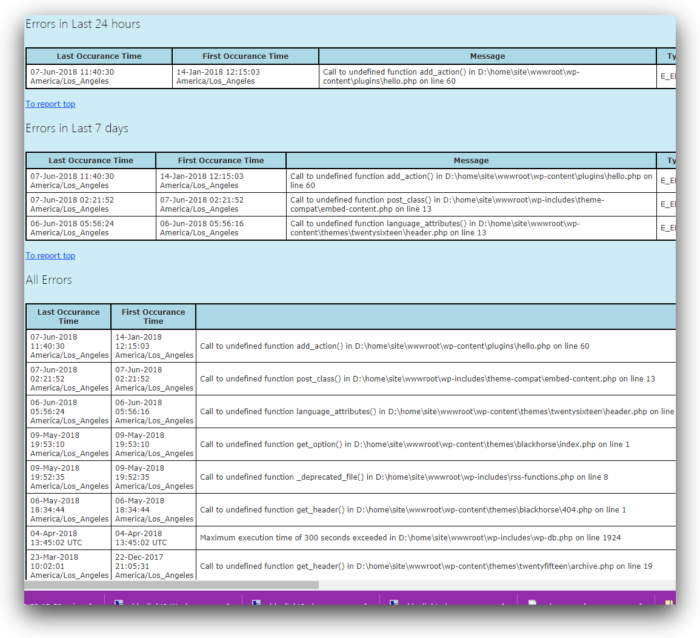
Working with just basic Azure logs, you get data in, data out, HTTP 5xx errors, number of requests, and average response times. How do you identify common errors? How do you identify problematic pages, bugs, or possible security events? What happens if a specific host is causing issues?
Here is what the default log viewer in Azure looks like. There is limited data on this page.
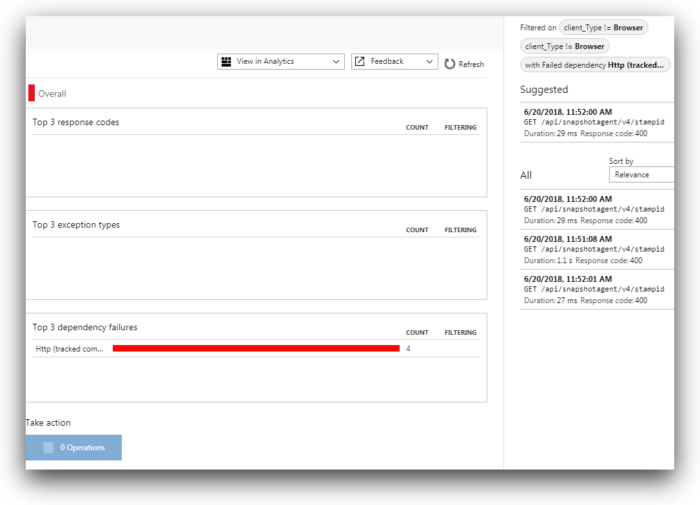
In the image above, we get the Azure list of HTTP errors on a small application. Four HTTP errors may not give us enough information to troubleshoot, and there is no way to drill down from this graph. For a critical application, you need more flexibility in your reports with the ability to drill down for more detail into what could be causing the issue.
How to Access Azure Logs
Azure stores log files for any resource as blob objects on its cloud servers. You can also store table log files to an FTP location by enabling it in your Azure portal. Azure offers several ways to view and copy files to your local machine or to another server using FTP, PowerShell, or the Azure web-based command-line system. Before you copy your log files to another location, you might want to take a look at them and review their size so you have a time estimate for transferring them. Microsoft offers cloud and desktop applications to help you. (See “How to: Download Logs” on this page to see a list of commands using PowerShell.)
If you only want to view application log files to see their size before copying them, Azure includes Kudu in each resource group in your web portal. You can use the Azure Kudu API and JSON output, but they also have a web-based GUI to view files. Click “Advanced Tools” and then “Go” in your Azure portal to open Kudu.

Click the CMD option in the “Debug Console” menu.

Kudu opens a basic DOS directory view of your application files. You’ll see a list of directories, including the LogFile directory that contains your blob files.

From Kudu, you can browse log files and download them one by one without installing any third-party application. If you want a little more user-friendly interface, Microsoft offers a desktop application named Azure Storage Explorer that performs similar functionality with a friendlier design and easier navigation, and it doesn’t require you to have the portal page open.
People who prefer to script file migrations have a few options: AzCopy (also provided by Microsoft), cURL commands after downloading the cURL executable for Windows (assuming you’re using Windows), or PowerShell.
Another option for .NET developers is to integrate logging directly into Visual Studio using Log4Net. You first need to download the Log4Net NuGet package in Visual Studio. Then, application logs are sent to Loggly from your developer environment.
For large enterprise organizations with several applications spanning Azure across multiple platforms, you may want to collect diagnostic logs in one location. Azure lets you create blobs of big data using Event Hubs. You can set up an Event Hub and stream your logs in real time to a container. The output from an Event Hub is JSON, which you can then use to transfer to Loggly using its bulk endpoint URL.
Using the Azure Fluentd Plugin with Loggly
If you have several application servers with logs across each one, Fluentd unifies data collection into one stream that you can then send to Loggly. You first need to create an Azure Service Principal for log access. The principal is an Active Directory application that is given permissions to access your server and application resource logs.
After the service principal is set up, you need to install the Fluentd plugin for Azure. The plugin will not only take your Azure logs and output data into JSON format, but also lets you connect your Azure logging service with Loggly seamlessly.
With the Fluentd logs installed, head over to Loggly and install the Loggly gem. Then, configure Fluentd to create a Loggly client.
You should send some example logs using Fluentd to Loggly before you finalize the installation for production. This will help ensure your configurations and setup are working properly. See the Loggly setup page for Fluentd to troubleshoot any issues.
Aggregating Application Logs with NXLog
If you just need application and event logs from your Windows VMs, you can optionally add NXLog to your installation. NXLog is a small application that runs in the background of your server and helps pull event logs from Windows and sends them to Loggly. You can download NXLog here.
After you’ve installed NXLog, copy and paste the Loggly configurations into nxlog.conf and restart the NXLog service.
NXLog is one of the most convenient ways to aggregate application logs to Loggly. You can use this method alongside to Fluentd to include application and infrastructure logs in your Loggly dashboard.
Using the Loggly Dashboard
With your log files uploaded, you can now create reports with far more analytic capabilities.
With Loggly, you get enterprise-level reporting with far more data points, features, search capabilities, charts, and collaboration. The Loggly search page includes more search features, plus it aggregates logs from many sources into a single event view.
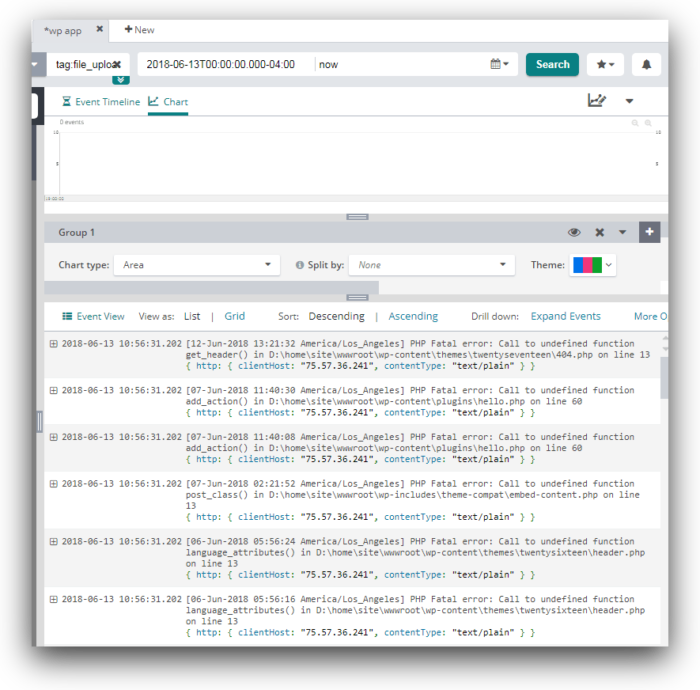
Now you can search and create custom dashboards based on your files. When you click the “Chart” link in your Loggly search dashboard, it automatically creates a graphic representation of your errors. You can choose from several chart types such as line, bar, pie, area, table, and several more. Compare these charts and flexible search features with the basic log printout from the first image in this article showing the Azure default log viewer. The search, graphing, and dashboard customizations give you much more insight to bugs and issues that could be affecting your application.
Save your charts and then customize a dashboard for a quick overview of your applications.
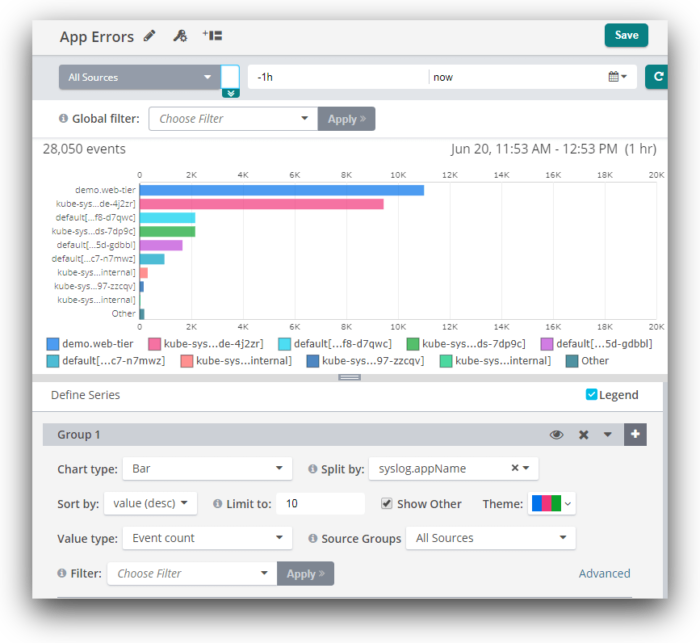
To name just a few reports you can get using Loggly:
- Application events by the hour
- Errors based on pages
- The number of events based on saved searches
- Activity based on host IP
- Alert analysis based on different events
- HTTP errors for each host and application
- Security events such as failed logins and blocked resources due to permissions
- Database errors including timeouts, invalid access, malformed parameters, and internal errors
- User agent traffic
- Server status codes by the hour
- Application response times
- Product purchases both failed and successful
Build charts and graphs, and gain valuable insight based on your own customized dashboards from the above data points or numerous others. Loggly gives you far more power to understand where your application can improve.
Aside from logs, the alerts are much more flexible. Loggly lets you customize your data searches and then create alerts based on your own business requirements. Combine alerts and customized reports for better analysis of your production environment, and you’ll get superior insights for application improvements and administration.
Conclusion
When it comes to production monitoring or troubleshooting problems quickly, you need a more powerful log management solution. Loggly provides you aggregated search across all Azure services and applications, powerful visualization, and smart alerting. Setup typically takes only a few minutes with agents like NXLog or Fluentd. Sign up for a free trial today.
The Loggly and SolarWinds trademarks, service marks, and logos are the exclusive property of SolarWinds Worldwide, LLC or its affiliates. All other trademarks are the property of their respective owners.

Jennifer Marsh
