Getting the Most Out of Java With SolarWinds Loggly
Logs are a developer’s first line of defense when monitoring and troubleshooting distributed applications. They provide insights into performance, user behavior, and application stability, whether your application is written in Java or another language. However, when your applications scale up, and you have fragmented log data scattered across different systems, this will complicate your troubleshooting effort. This is what makes a centralized logging tool like SolarWinds® Loggly® essential.
In this article, we’ll explore the challenges of Java application logging and discuss how integrating SolarWinds Loggly can enhance your logging strategy to ensure optimal performance and easier debugging.
The Challenges of Troubleshooting Java Applications
The Java programming language and its supporting frameworks have evolved significantly since their initial development. Java’s versatility has led to widespread usage, with its applications deployed in diverse environments and serving various use cases. Still, when it comes time for developers to troubleshoot their Java applications, they face several unique challenges.
Non-standard builds
When designing and building Java applications, each organization and each team within an organization adopts its own set of patterns, frameworks, code structures, and dependency management processes. As a result, logs differ widely from one application to the next. Depending on the service, they differ in structure, granularity, and format.
As developers must adjust to the unique logging formats of each service, the complexity of their debugging task increases.
Multithreading complexities
Java has built-in support for multithreading through the Thread class and Runnable interface. However, Java applications that use multithreading may generate logs out of temporal order, making it difficult for developers to correlate logs for a user action.
Distributed systems and microservices
Because the Java Virtual Machine (JVM) is platform-independent, Java applications can be deployed easily within any environment or system. This makes Java a popular choice for complex distributed environments. However, this means that generated logs are scattered across services and nodes. Tracking down and correlating those logs for debugging can be a time-consuming and difficult process.
Diverse deployment environments
JVM’s interoperability across platforms makes it easier to deploy Java applications in various environments, including on-premises, cloud, and containers. Developers must be familiar with these systems’ logging formats to generate compatible logs during development and ensure the logs are consistently structured.
Verbose logs by default
The verbose java.util.logging (JUL) package with Java offers built-in logging support, but this default can make it challenging for developers to separate pertinent logs for debugging problems.
Java’s Built-In Logger Versus Centralized Logging
The Java Development Kit (JDK) provides built-in support for logging using JUL. JDK creates easy log application events and errors, allowing developers to debug runtime issues. Although JUL serves basic logging needs, it lacks features (such as custom log formats, async logging, and structured log formats), making it insufficient for advanced use cases.
As applications grow and become more complex, the need for advanced logging features also grows. Otherwise, troubleshooting and monitoring processes will take longer, as searching through large log files across multiple systems becomes increasingly difficult.
JUL doesn’t provide built-in support for centralized log management and analysis, which are vital for monitoring and maintaining applications in distributed systems or cloud environments. Modern organizations need to efficiently aggregate and correlate logs from multiple sources.
Centralized logging consolidates log data into a single platform. With an aggregated view of logs, developers have better visibility for debugging and monitoring applications in real time.
Developers can set up metric tracking dashboards and alerts across systems for proactive monitoring. Additionally, a unified view with a consistent and traceable record of application activities provides a single source of truth, simplifying the organization’s compliance and auditing needs.
What to Expect From a Centralized Logging Tool
With a centralized log management tool, you can capture, transform, and analyze logs from multiple systems. The common components of a centralized logging system include:
- Log handling: The logging service gathers the logs generated by various applications and transports them to a centralized location for storage.
- Transformation: Different applications often use different log formats, structures, and logging levels. The centralized logging tool transforms the logs into a standardized format before storing them for efficient querying and retrieval.
- Querying and indexing: This allows developers to monitor and troubleshoot their applications through large log volumes collected from multiple systems quickly and efficiently. This is an important feature for centralized logging platforms.
- Security and access control: Centralized logging platforms need to prioritize security because data may contain sensitive or personally identifiable information (PII) from multiple systems. Organizations should configure fine-grained access controls to restrict access and protect this sensitive information.
Best Practices for Java Application Logging With a Centralized Logging Tool
To get the most out of centralized logging in Java applications, implement the following best practices:
Capture framework logs
Suppose your Java application uses a framework such as Spring Boot or Hibernate. In that case, capturing both application and framework logs is important for a complete picture of the application behavior across all application layers.
For example, if the application uses Spring Boot’s built-in support to handle HTTP requests, important details about connection or API errors would only be available in the framework logs. Refer to these instructions on centralizing Java logs.
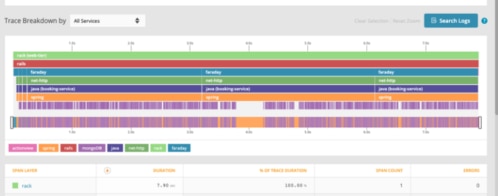
Use trace IDs
While working in a distributed environment or with microservices, embedding trace or correlation IDs in your logs allows you to trace the single user request across multiple services, simplifying the debugging process.
Use Logback
To efficiently route logs to a centralized logging platform, use the Java Logback extension, which provides extensive customizability and is compatible with most centralized logging platforms.
Capture exceptions
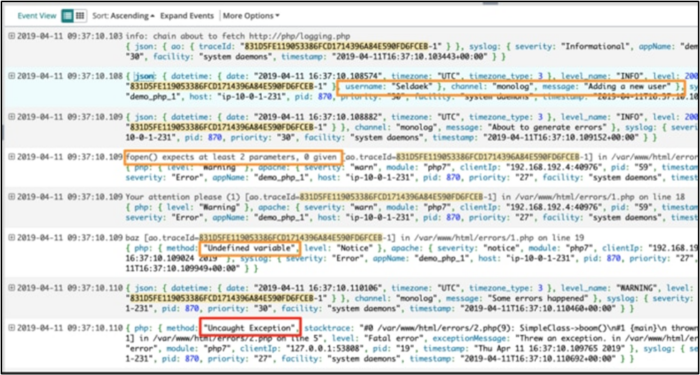
When an exception occurs, capturing a detailed report is crucial. This report should include the reason for the error, metadata, application state, and stack traces for effective troubleshooting. You might need to implement a custom handler to capture runtime exceptions and their associated stack traces to avoid losing information if the application exits due to the exception. The Java Logging Basics guide explains how to capture exceptions in a Java application.
How SolarWinds Loggly Improves Logging With Java
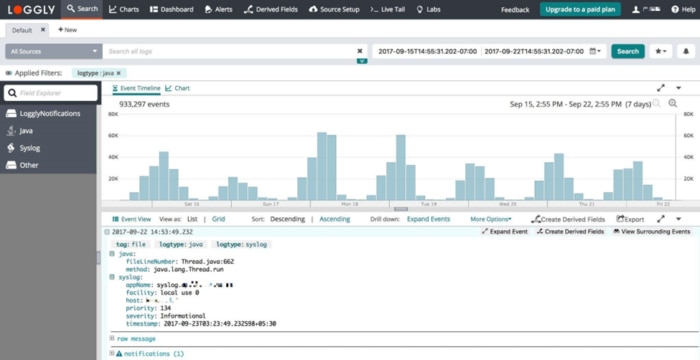
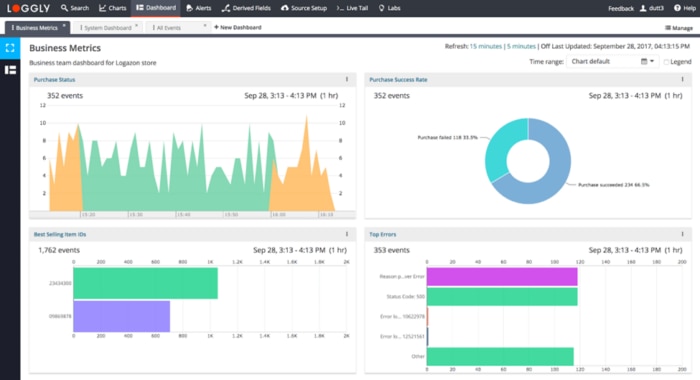
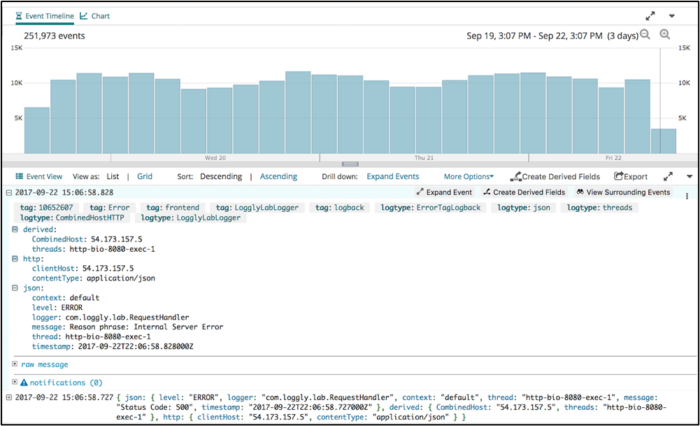
SolarWinds Loggly is a managed log data management service that provides a scalable infrastructure to ingest, normalize, and aggregate Java logs from diverse environments. Developers can build visualizations and dashboards and set up threshold-based alerts to monitor applications for problems. SolarWinds Loggly efficiently views and searches large log data volumes to investigate system issues.
SolarWinds Loggly is a valuable part of monitoring and deployment workflows that integrates seamlessly with DevOps tools like JIRA, Slack, Microsoft Teams, PagerDuty, and other alerting systems.
Sign up for a free SolarWinds Loggly trial to start centralized monitoring for your Java applications today.
The Loggly and SolarWinds trademarks, service marks, and logos are the exclusive property of SolarWinds Worldwide, LLC or its affiliates. All other trademarks are the property of their respective owners.

Loggly Team