Getting the Most Out of Python with SolarWinds Loggly
An audit and error trail is one of the core pillars of a well-designed software application, regardless of the programming language used to build it. This trail typically comes in the form of logging. When your application produces useful, rich logs, you are better equipped to successfully maintain a production-grade system and troubleshoot any issues that might arise.
When it comes to distributed Python applications, having correlated logs for each system is important for debugging. For example, consider when a payment service talks to an order fulfillment service. Here, an audit trail can be extremely useful when debugging issues to track events in their particular order.
The audit trail sources a large volume of error logs and log levels from many different machines. Logging is one thing, but managing a large volume of logs scattered across machines leads to tremendous toil for any developer.
What’s the solution? A centralized logging tool that aggregates logs across all the machines and containers for a distributed system, powering alerts and dashboards for swift troubleshooting.
In this article, we’ll focus on logging within Python-based applications. We’ll cover some of the best practices for Python logging and what to expect from a centralized logging tool to master Python applications.
Best Practices when Logging in Python
Python has its built-in logging module, and this is a good way to start logging in Python. It’s a step above using print() statements in your code. Set different log levels and change them at runtime if more debug-level information is required. Learning to use the default logger and setting the log levels properly is foundational to building a well-instrumented application.
Other loggers are available within certain Python HTTP server frameworks. These include:

These logging modules are extensions of the Python logging module but offer hooks to customize the logging output produced.
Another effective method for generating useful logs within a Python application involves using structured logs, such as those in key-value pair or JSON format. This allows a centralized logging tool to easily extract key fields to build queries and produce service performance metrics.
Along with using structured logging, embedding key information into logs will help you correlate logs across systems and track down issues for individual users. This additional contextual information may include:
- Trace IDs
- User IDs
- A globally unique ID (GUID)

Why Use Centralized Logging for Python Applications?
Imagine a basic Python application running on a single server. When you need to view the logs, you connect to the server and tail the log file, stdout, or stderr the application. That seems simple enough.
Now, imagine running dozens, hundreds, or thousands of servers or containers producing logs from your Python applications. These applications run in distributed computing environments like Kubernetes or a function-as-a-service (FaaS) offering like AWS Lambda. If you open multiple terminals and tail several logs, bouncing between different log screens to troubleshoot an issue will soon become overwhelming and entirely ineffective.
This scenario clearly shows that centralized logging is necessary to correlate events from multiple components within a single system. You simply use an identifier to query a log set, regardless of the machine, language, or format running.
Centralized logging also provides a single place to visualize metrics and generate alerts. As your Python applications emit logs, the centralized systems handle managing and helping you understand what those logs mean at the aggregate level.
What to Expect from a Centralized Logging Tool
Key features of a centralized log management tool include:
- Support for multiple languages: You should be able to send logs from applications written in Python, Go, TypeScript, Java, or any other widely adopted programming language.

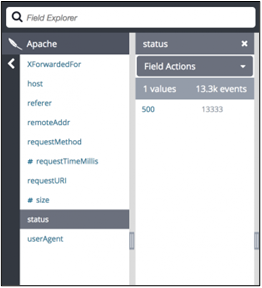
Extract key fields: Allow for querying and building useful alerts and dashboards based on key fields within log entries.

- Connect seamlessly to DevOps tools: Integrate your log management tool with existing processes, such as Slack, for alerting or generating tickets in an incident management tool.
- Facilitate advanced data analytics: Generate deep insights by shipping logs to systems that can perform advanced analytics.
- Provide easily configurable access controls and retention policies: Simplify information sharing within your organization while effectively managing costs.
Achieving Best Results when Using a Centralized Logging Tool
For the best results with a centralized logging tool, find something designed to easily hook into frameworks like Django and Flask. With minimal configuration, start sending your HTTP server logs to a centralized log management tool. You’ll quickly benefit from having rich, structured logs and improved visibility.
It’s also important to send generic application logs over HTTP to a centralized service, which makes it easy to centralize the logs even with lesser-known web frameworks. This is especially important for PaaS/FaaS Python Applications, where simply tailing log files with a tool like Fluentd might not be an option.
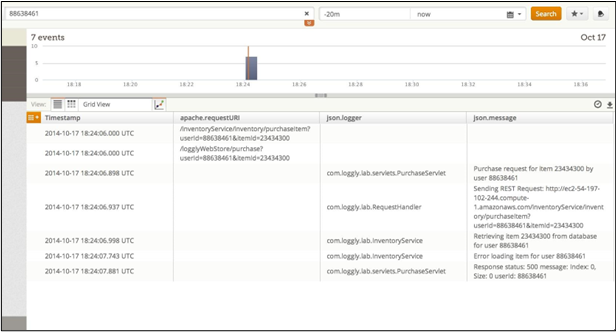
An identifier can trace events between different parts of the system to correlate logs. This tool will identify issues that only affect a subset of users or only happen for certain data types within the system.
The centralized tool automatically captures server and HTTP errors. It is a simple way to view exceptions and find the error source, such as a stack trace.

SolarWinds Loggly Gets the Most Out of Logging with Python
SolarWinds® Loggly® is a centralized logging tool that offers everything you need to manage Python application logging effectively—all in one place. It provides proactive issue identification and notification via automated alerts sent to various chat tools, including Jira, PagerDuty, Slack, and Microsoft Teams, and facilitates powerful search queries to help you tackle real-time troubleshooting.
SolarWinds Loggly simplifies investigation and KPI reporting across Python applications, ensuring that one tool gets the whole story. Its integration with tools like GitHub enables easy tracing of the source of the issue to the line of code in question.
If you’re looking to simplify and improve logging with your Python apps, sign up for a free Loggly trial.
The Loggly and SolarWinds trademarks, service marks, and logos are the exclusive property of SolarWinds Worldwide, LLC or its affiliates. All other trademarks are the property of their respective owners.
Loggly Team


