New ways to monitor error and exception data
Errors and exceptions happen. It’s not a matter of if or even when; it’s a matter of how many. And in a software development world with faster innovation cycles and continuous delivery, smart DevOps teams need a log management system that proactively monitors for errors and exceptions so they know what’s “normal” and can act quickly when problems crop up. Fortunately, Loggly has made this a lot easier with new automated parsing for errors and exceptions.
Support for Many Common Default Exception Formats
Loggly now parses default exception formats from Django, JavaScript, Log4j, Logback, Node.js, PHP, Python, and Rails.
For example, a Log4j event might look like this:
2014-10-16 01:32:22,780 ERROR main Sample.main - java.lang.NullPointerException: Sample Log4j Exception#012#011at Sample.errorLevel3(Sample.java:35)#012#011at Sample.errorLevel2(Sample.java:31)#012#011at Sample.errorLevel1(Sample.java:27)#012#011at Sample.main(Sample.java:16)#012
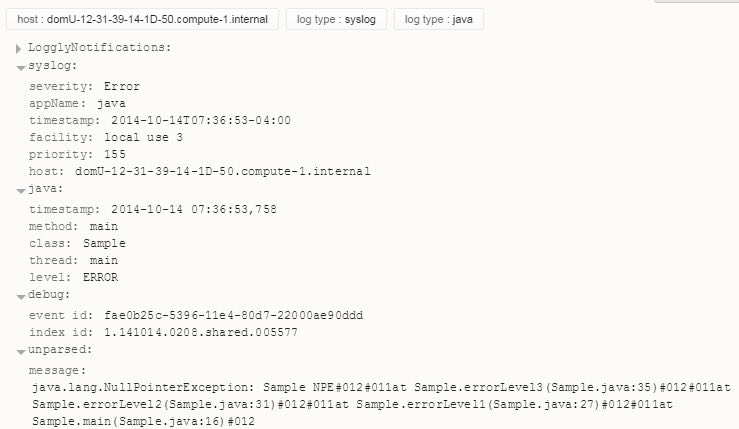
Once parsed, the same event looks like this in Loggly:

Note that Loggly has parsed:
- Time stamps, facilitating time-based searches
- Exception types, so that you can report metrics on individual exception types
- Exception messages
- Stack traces, so you can determine exactly where the exception occurred and trace problems through the whole stack
Automated Error Parsing in Troubleshooting
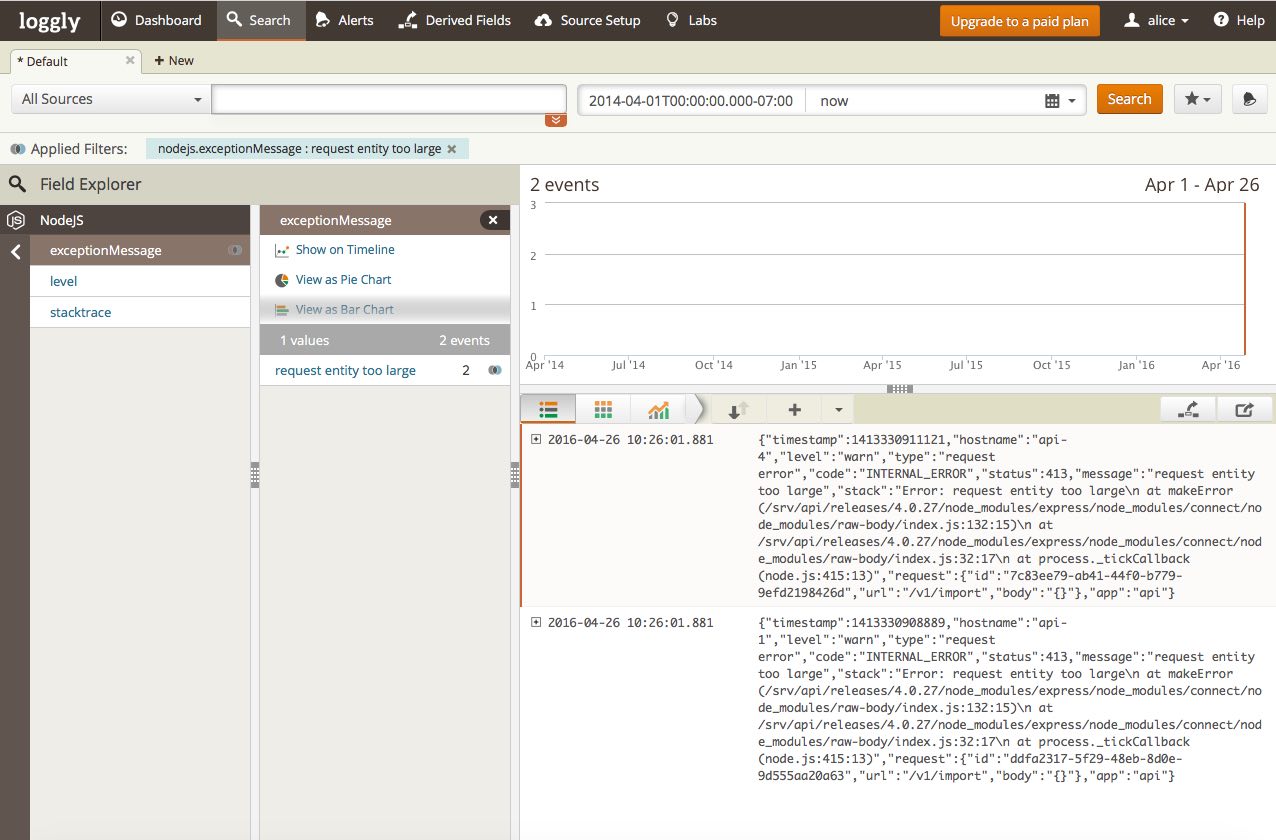
Let’s say that you received a customer complaint that she is unable to complete an update in your software. When you log in to Loggly, Loggly Dynamic Field Explorer™ gives you a bird’s-eye view of your log data. You can navigate through all of your logs and see summaries of aggregate values, including errors from our Java stack traces. You immediately see which code paths are throwing exceptions. Since you know right away where to look for your problem, you’re able to get your customer back on track in a few minutes.

Just drill down on your log data using our handy point-and-click interface. Behind the scenes, Loggly is automatically counting the number of events in your logs. You don’t need to iterate on a bunch of individual queries.
Automated Error Parsing in Proactive Monitoring
Of course, you’d much rather know about a critical error before it’s affecting a customer. For errors and exceptions that Loggly is parsing, it’s easy to set up alerts to detect spikes in error counts.
Error Parsing Reveals What Matters in Your Logs
In the past, we have talked about how Loggly Dynamic Field Explorer™ provides real-time visibility into the contents of your logs. While other vendors are focused on giving users more powerful and complicated tools (“better metal detectors”) for finding treasure, we’re aiming to do much of the hard work for you. We want to reveal what matters, summarizing what we find in a “treasure map” so that you start with knowledge on the most likely root causes and can easily monitor for problems using log data. Error parsing is the next step forward in this strategy.
There’s no better way to experience better troubleshooting and monitoring than to send your application logs to Loggly. If you’re not yet a Loggly customer, get started with a free trial today!
Additional Reading on Logging Exceptions:
- Logging Exceptions in Java
- Logging Exceptions in Python
- Logging Exceptions in C#
- How to Implement Contextual Logging
The Loggly and SolarWinds trademarks, service marks, and logos are the exclusive property of SolarWinds Worldwide, LLC or its affiliates. All other trademarks are the property of their respective owners.
Loggly Team


