Optimizing Tableau Performance with Loggly
If you use Tableau to query a database directly, this blog post will help you use Loggly to quickly find queries that have high latency. With this information you can determine if indices need to be added in your database schema for optimizing Tableau performance.
When connected directly to a database, Tableau essentially does drag-and-drop query-building using graphics. Internally, that query is being translated into a declarative language such as SQL which is processed and transferred back into graphics for the user.
Tableau is architected in a way that maps very well to relational algebra, so it can elegantly translate a graphical interface into a query language and does not require the user to import the data from the database into an analytical silo. Tableau enables users to explore data quickly. Usually, when one is able to visualize data, further questions arise.
Lately I have been using Tableau to explore data produced by our backend system to continue improving search performance at Loggly. I have used Tableau for several years and think the product is awesome.
However, as I collected more data and tried to answer more questions, the performance of my Tableau queries started to deteriorate. So now I had two problems at hand: how to analyze data to improve performance at Loggly using Tableau, and how to improve Tableau’s own query performance.
I decided to use Loggly to analyze Tableau’s logs, as Tableau recommends analyzing its own logs to improve its query performance. Since Tableau stores its logs in JSON format, it is not easy to analyze them with Tableau itself, which requires a tabular data format. Here is an example of a Tableau log entry:
This file contains hidden or bidirectional Unicode text that may be interpreted or compiled differently than what appears below. To review, open the file in an editor that reveals hidden Unicode characters.
Learn more about bidirectional Unicode characters
| {"ts":"2015-07-29T15:51:21.138","pid":8102,"tid":"d70cd","sev":"info","req":"-","sess":"-","site":"-","user":"-","k":"begin-query","v":{"query-hash":2908488633,"query":"SELECT NOW() AS `COL`","protocol-id":54}} |
This file contains hidden or bidirectional Unicode text that may be interpreted or compiled differently than what appears below. To review, open the file in an editor that reveals hidden Unicode characters.
Learn more about bidirectional Unicode characters
| #! /usr/bin/env python | |
| import os | |
| import requests | |
| # Your loggly token | |
| TOKEN = "046601bd-xxxx-xxxx-xxxx-36a977ecda02" | |
| TAG = "tableau" | |
| # For a Mac user | |
| path = "/Users/<username>/Documents/My Tableau Repository/Logs" | |
| # For a PC user, uncomment the line below | |
| "C:/Users/<username>/Documents/My Tableau Repository/Logs" | |
| os.chdir(path) | |
| with open("log.txt") as file: | |
| data = file.readlines() | |
| # We use the Loggly bulk API to send data over http | |
| r = requests.post("https://logs-01.loggly.com/bulk/%s/tag/%s/" % | |
| (TOKEN, TAG), ''.join(data)) | |
| print "Loggly response: %s" % r.status_code |
Now, let’s log in to Loggly. The log data will have already been parsed as JSON fields so that we can search on specific fields.
We want to find log messages emitted when a query ends, and in particular, we want queries that have a WHERE or GROUP BY clause, so that we can look at columns that may need indices:
Here is our search: tag:tableau json.k:"end-query" WHERE GROUP
In Loggly, we can create a Grid View to look at the fields we are interested in. We want to see how many rows were returned, how long the query took, and which query was used.
You can then sort in descending order to see the slowest queries first.
Here is how it looks: 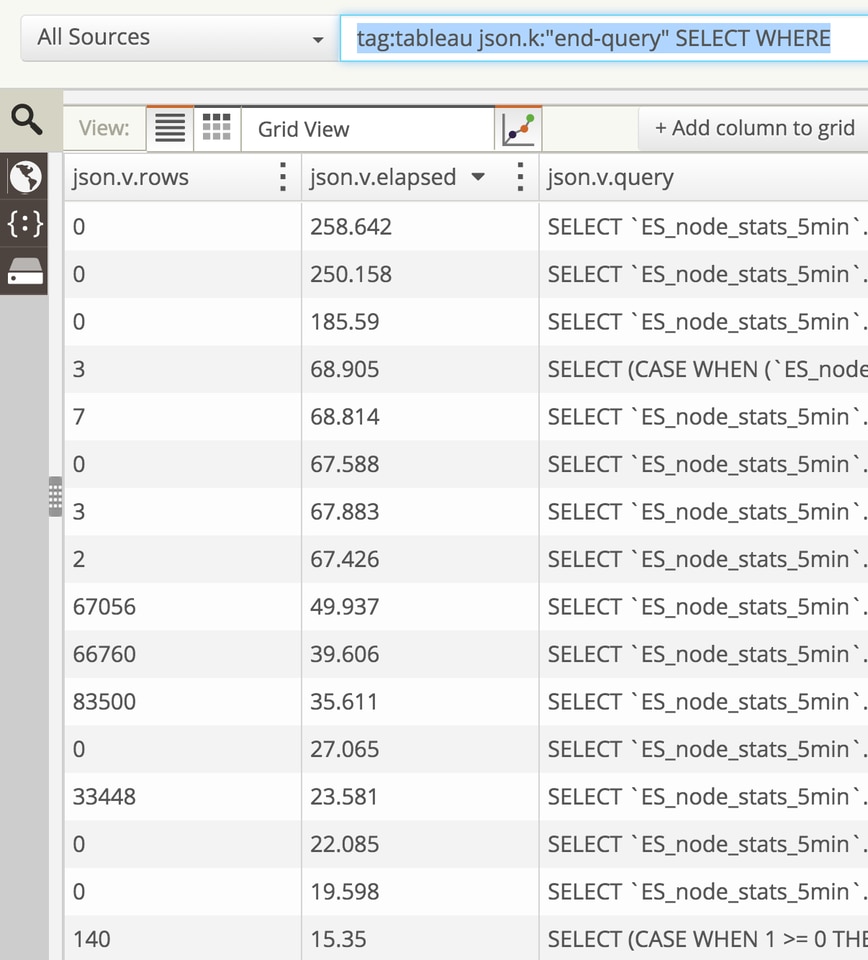
Now you can inspect the slowest queries and see if we have indices set up for the columns being used either in JOINs or as part of a WHERE or GROUP BY clause.
Monitoring Tableau’s Performance with Loggly
If you want to monitor Tableau’s performance on an ongoing basis, you can use a more complex version of the Python script introduced above.
This will correctly deal with timestamps, so that we can plot trends. Additionally, it will transform some values, such as “-“, which Loggly does not like, so we replace them with “None”.
You can specify the time range of data you want to extract from the log files and then run the script periodically, either by using a cron job in Mac or with the Windows Task Scheduler.
This file contains hidden or bidirectional Unicode text that may be interpreted or compiled differently than what appears below. To review, open the file in an editor that reveals hidden Unicode characters.
Learn more about bidirectional Unicode characters
| #! /usr/bin/env python | |
| import os | |
| import requests | |
| import pytz | |
| import datetime | |
| import json | |
| import logging | |
| import time | |
| # | |
| # Config parameters | |
| # | |
| H = 24 # Period for data to be parsed, in hours. IF 0, will include all | |
| S = 5000 # Size of chunks for bulk sending of log data to Loggly | |
| OS = 'mac' # OS where Tableau Desktop runs - mac or windows | |
| USERNAME = 'your_name' # your username in your os as it appears in your path | |
| FILENAME = ['log.txt','log_1.txt'] # File with log data (a smarter version will look into their dates) | |
| TOKEN = "046601bd-xxxx-xxxx-xxxx-36a977ecda02" | |
| TAG = 'tableau' | |
| local = pytz.timezone ("America/Los_Angeles") # Time zone in your computer where Tableau resides | |
| def transform_timestamp(timestamp): | |
| """ | |
| Transforms a Tableau log string timestamp into an ISO-formatted string timestamp | |
| Note: If timestamp is too far in the past it will not be parsed by Loggly as a time field | |
| and it will give the following notification: | |
| message: json timestamp rejected because it is too far in the past. | |
| type: TimestampBelowFloor | |
| """ | |
| naive = datetime.datetime.strptime (timestamp, "%Y-%m-%dT%H:%M:%S.%f") | |
| tdelta = datetime.datetime.now() - naive | |
| local_dt = local.localize(naive, is_dst=None) | |
| utc_dt = local_dt.astimezone (pytz.utc) | |
| return utc_dt.isoformat(), tdelta.days*24 + tdelta.seconds/3600.0 | |
| def set_path(): | |
| """ | |
| Sets the path to the Tableau log according to the OS | |
| """ | |
| if OS == 'mac': | |
| return "/Users/%s/Documents/My Tableau Repository/Logs" % USERNAME | |
| elif OS == 'windows': | |
| return "C:/Users/%s/Documents/My Tableau Repository/Logs" % USERNAME | |
| else: | |
| print "Verify your OS setting" | |
| exit(1) | |
| def chunks(l, n): | |
| """Yield successive n-sized chunks from l.""" | |
| for i in xrange(0, len(l), n): | |
| yield l[i:i+n] | |
| level=logging.INFO | |
| logging.basicConfig(format='%(asctime)s [%(levelname)s] [%(name)s] %(message)s',level=level) | |
| logger = logging.getLogger("Tableau parser for Loggly") | |
| path = set_path() | |
| logger.info("Setting path to log file as %s" % path) | |
| os.chdir( path ) | |
| logger.info("Reading log data as list of strings") | |
| for f in FILENAME: | |
| logger.info("Parsing file %s" % f) | |
| with open(f) as file: | |
| log_data_as_str = reversed(file.readlines()) | |
| logger.info("Transforming log data to a list of dictionaries") | |
| log_data_as_dict = [json.loads(x) for x in log_data_as_str] | |
| logger.info("Adding user and timestamp field with ISO-8601 format") | |
| for msg in log_data_as_dict: | |
| msg['user'] = USERNAME | |
| msg['timestamp'], msg['tdelta_sec'] = transform_timestamp(msg['ts']) | |
| # Replace "-" in the value with "None" in order to be interpretable by Loggly | |
| for k,v in msg.items(): | |
| if v=="-": | |
| msg[k] = "None" | |
| logger.info("Found %d log messages" % len(log_data_as_dict)) | |
| if H > 0: | |
| logger.info("Filtering result set to last %d hours" % H) | |
| log_data_filtered = [ x for x in log_data_as_dict if x['tdelta_sec'] < H] | |
| else: | |
| log_data_filtered = log_data_as_dict | |
| filtered_msg_count=len(log_data_filtered) | |
| logger.info("Writing %d log messages" % filtered_msg_count) | |
| if filtered_msg_count > 0: | |
| ending_timestamp = log_data_filtered[0]['timestamp'] | |
| initial_timestamp = log_data_filtered[-1]['timestamp'] | |
| logger.info("Output messages begin at %s UTC and end at %s UTC" % ( | |
| initial_timestamp, ending_timestamp)) | |
| logger.info("Transforming dictionary to a list of strings") | |
| log_data_as_txt = [json.dumps(x) for x in log_data_filtered] | |
| logger.info("Splitting messages into chunks of size %d each" % S) | |
| log_data_as_chunks = chunks(log_data_as_txt, S) | |
| logger.info("Sending log data to Loggly in chunks") | |
| for c in log_data_as_chunks: | |
| r = requests.post("https://logs-01.loggly.com/bulk/%s/tag/%s/" % | |
| (TOKEN, TAG), '\n'.join(c)) | |
| logger.info("Loggly response: %s" % r.status_code) | |
| time.sleep(1) |
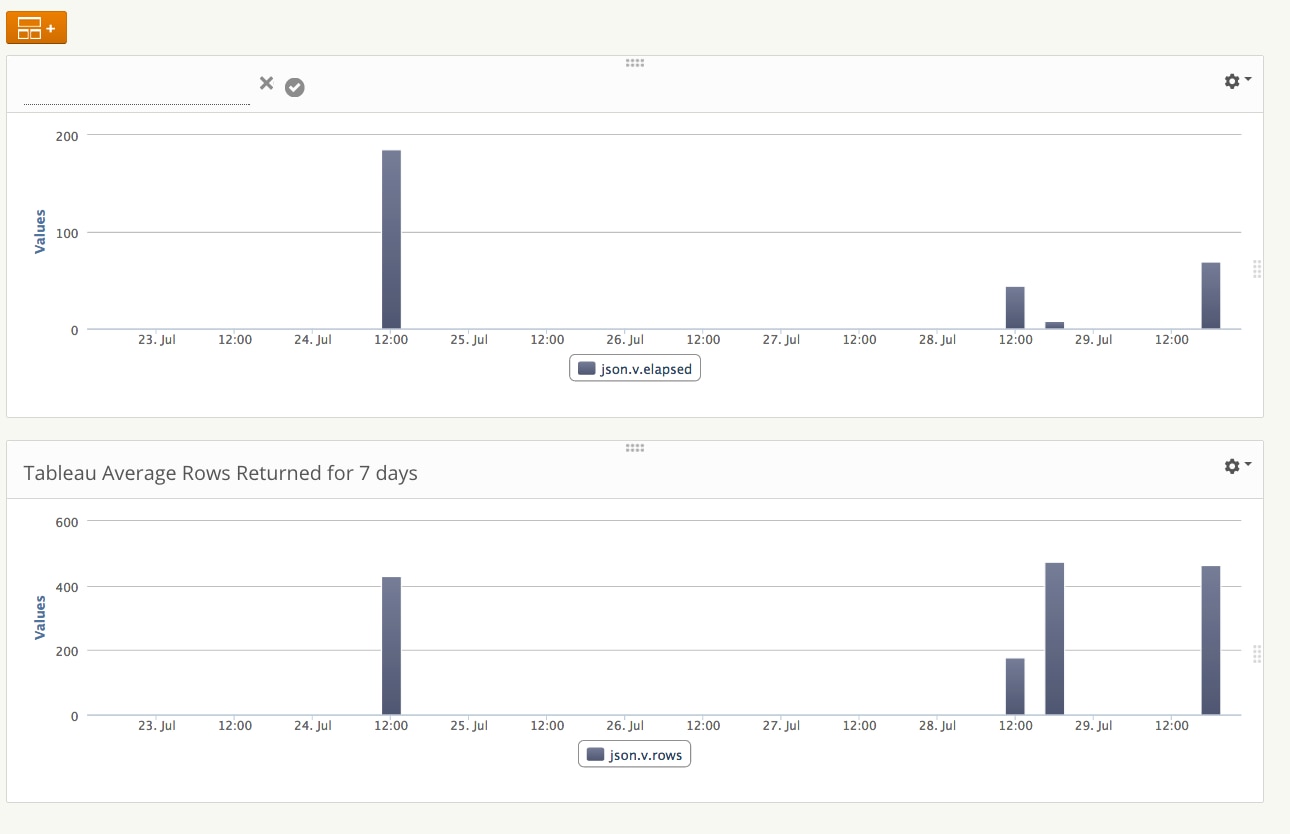
After collecting data for a few days, you can plot dashboards in Loggly to show your query performance (I like to look at the highest latency), as well as other metrics such as average rows returned from queries. In my particular case, I have reduced the worst performance by creating indices on columns that I use as filters.
References
Here is a good early article that shows the founder’s trajectory and vision for Tableau’s technology: https://www.sramanamitra.com/2010/03/05/how-to-get-a-20-million-pre-money-valuation-for-series-a-tableau-software-ceo-christian-chabot-part-3/
Here is Tableau’s official recommendation for improving Database Query Performance: https://kb.tableau.com/articles/knowledgebase/database-query-performance
The Loggly and SolarWinds trademarks, service marks, and logos are the exclusive property of SolarWinds Worldwide, LLC or its affiliates. All other trademarks are the property of their respective owners.

Mauricio Roman