Using SolarWinds Loggly to Get the Most Out of MongoDB Structured Logging
Logs are essential for understanding and optimizing performance, and MongoDB structured logging makes them more powerful. By organizing logs into a consistent format, we can query and analyze them more efficiently. However, dealing with logs locally has its limits. That’s where a centralized log management tool like SolarWinds® Loggly comes in.
Shipping MongoDB logs to SolarWinds Loggly gives you a unified view of your data, advanced analytics, and proactive monitoring. In this guide, we’ll show you how to configure your environment to send MongoDB structured logs to SolarWinds Loggly. Then, we’ll look at how to use SolarWinds Loggly to query and analyze them effectively.
Understanding structured logging in MongoDB
Logs are essential for understanding system behavior. MongoDB makes it easier to query, analyze, and act on the data by outputting all logs in a structured JavaScript Object Notation (JSON) format.
- Ease of querying: JSON logs enable quick filtering and searching by fields such as timestamps or operation types.
- Improved debugging: Consistent log entries make it easier to trace issues and identify root causes.
- Actionable insights: Structured logs reveal patterns and bottlenecks, helping us optimize performance.
The default log entries in MongoDB already include handy fields such as timestamps and severity levels, which can be customized to capture additional details as needed. This makes structured logging a robust foundation for managing and understanding your data.
Next, we’ll look at why sending these logs to a centralized tool like SolarWinds Loggly takes this capability to the next level.
Why ship MongoDB structured logs to a centralized log management tool
While structured logging in MongoDB is a great start, managing logs locally can quickly become unwieldy, especially as the volume of data grows. Storing logs on individual machines makes it difficult to correlate events across different systems or scale your log management efforts.
This is where centralized log management tools, such as SolarWinds Loggly, come into play. Why move logs to a centralized tool like SolarWinds Loggly?
- Unified view: With all logs in one place, you can easily see the bigger picture, including logs from multiple servers or applications.
- Advanced analytics: SolarWinds Loggly allows you to search, filter, and visualize logs, helping identify patterns and trends.
- Scalability and retention: A centralized tool can handle large log volumes and provide longer retention, ensuring you can always access historical data.
- Proactive monitoring: With the alerting capabilities of SolarWinds Loggly, you can set up real-time notifications for critical events, such as database errors or performance issues.
Let’s dive into how we can set up our MongoDB environment to start sending its logs to Loggly
Configuring MongoDB environment to export structured logs to SolarWinds Loggly
To get the most out of SolarWinds Loggly, we need to set up the file log monitoring process to forward entries from the MongoDB log file to SolarWinds Loggly. The setup is straightforward. Just follow the steps below:
Step 1: Verify your MongoDB logging configuration
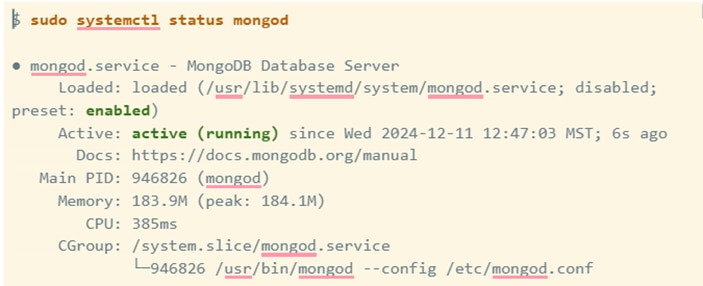
Verify that MongoDB is up and running on your machine.
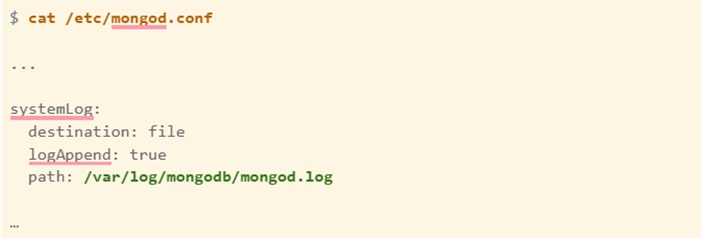
Then, check your MongoDB configuration (/etc/mongod.conf) for your logging configuration.
Modify the permissions of the MongoDB log file, as rsyslog (which will be configured to monitor and export the MongoDB log to SolarWinds Loggly) will need to read it.

Step 2: Obtain your Loggly credentials
If you do not have a SolarWinds Loggly account, sign up to create one for free. Then, log in to your account. You’ll need to copy several pieces of information, which you’ll then use to configure log exporting.
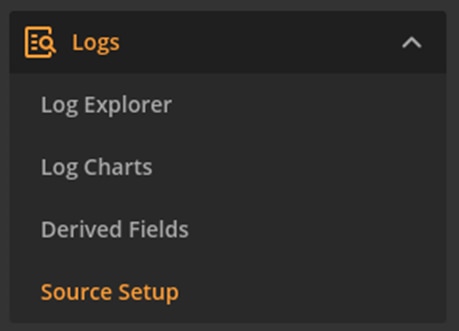
Navigate to Logs > Source Setup.
Next, navigate to the Customer Tokens tab.

First, find your account SUBDOMAIN. This is at the start of the URL after you log into Loggly. For example, the URL may be similar to mydomain.loggly.com/sources/browser. In this case, the SUBDOMAIN would be mydomain.
Here, you’ll create a new token for authenticating to your SolarWinds Loggly account when your system sends logs. Click Add New.
Provide a description for your new customer token. Then, click Save.
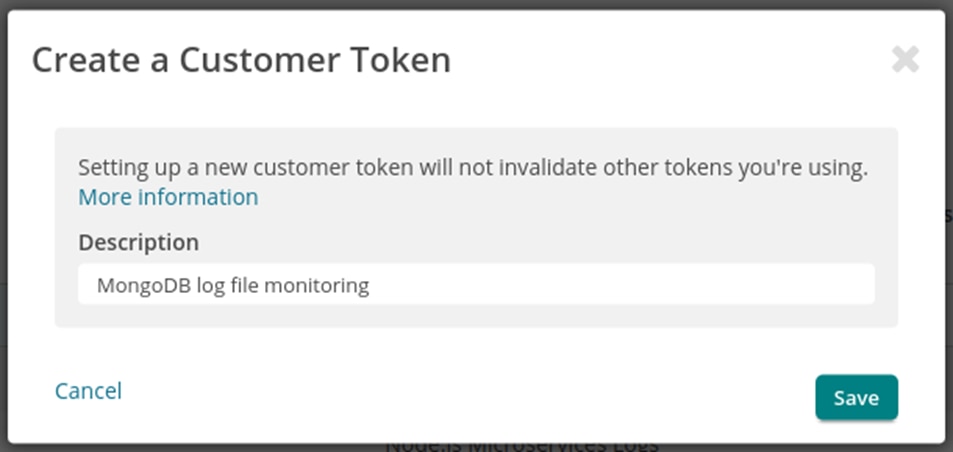
Copy the value of the newly created token.

Step 3: Configure the Loggly log file monitoring process
SolarWinds Loggly provides a continuous log file monitoring tool to configure rsyslog to ship your logs to SolarWinds Loggly. First, download the tool to the machine where MongoDB is running.

Then, run the configuration tool at the command line:

Replace the argument values as listed below:
SUBDOMAIN:The account subdomain for your Loggly accountTOKEN:The value of the customer token you created in the previous stepUSERNAME:Your Loggly account username, which you can find by going tohttps://<SUBDOMAIN>.loggly.com/account/users/LOG-FILE-PATH:The log file path shown in your MongoDB configuration, likely /etc/mongod.conf
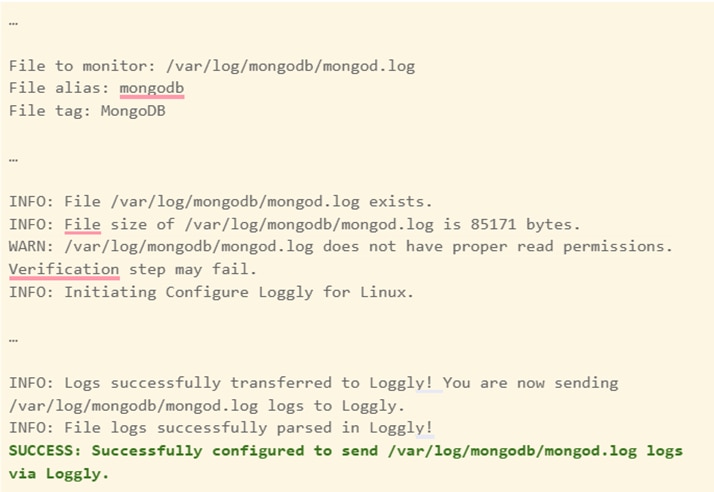
You’ll also be asked to enter your SolarWinds Loggly account password when running the configuration script. The output of running the configuration script will look like this:
Step 4: Verify the presence of logs in SolarWinds Loggly
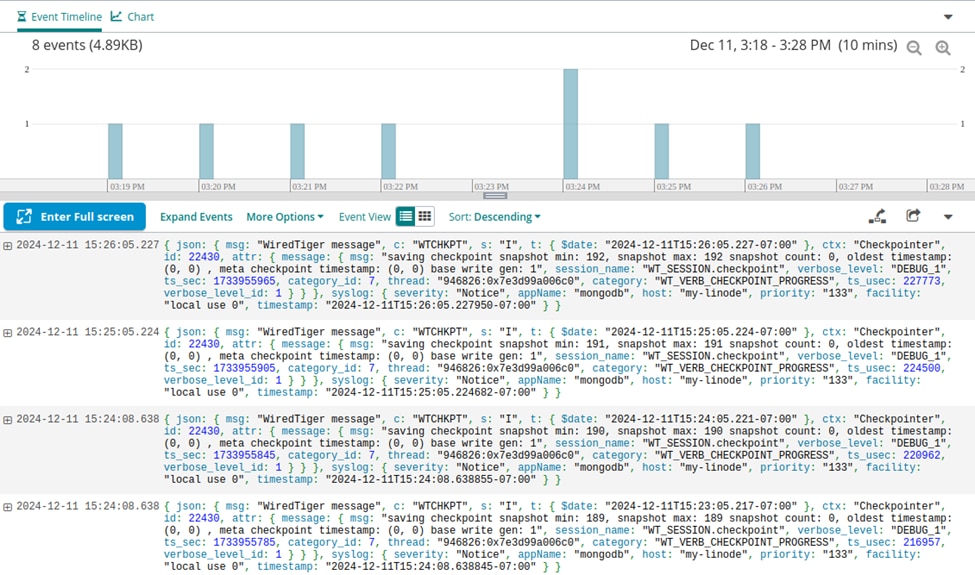
Now that your logs are shipping to SolarWinds Loggly, navigate to the Log Explorer. Underneath the Field Explorer search field, click Other. Then, select tag. From the list of tags shown, click MongoDB.

You’ll see recent log entries from your MongoDB log file, now shipped to SolarWinds Loggly.
Working with MongoDB structured logs in SolarWinds Loggly
Now that your MongoDB logs are flowing into SolarWinds Loggly, it’s time to put the centralized log management power to work. SolarWinds Loggly makes it easy to search, analyze, and visualize logs, giving you actionable insights to improve performance and quickly resolve issues.
Querying MongoDB logs
The query functionality of SolarWinds Loggly is one of its most powerful features.
Search by fields
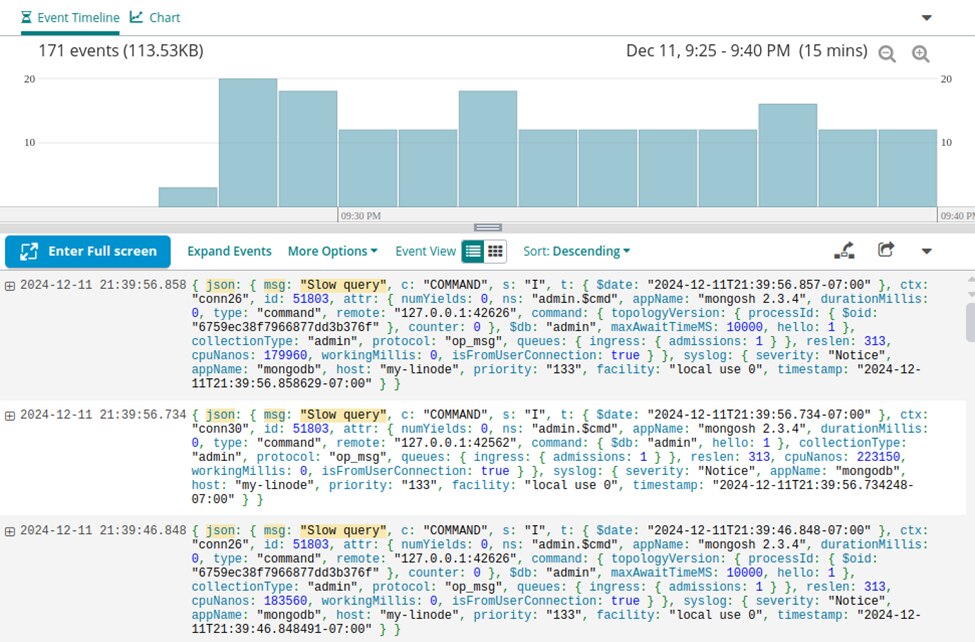
Use MongoDB structured log fields (such as command or msg) to filter logs. For example, to find all log entries related to the “Slow query” message, you would step through the field explorer to find select values from the available JSON keys.
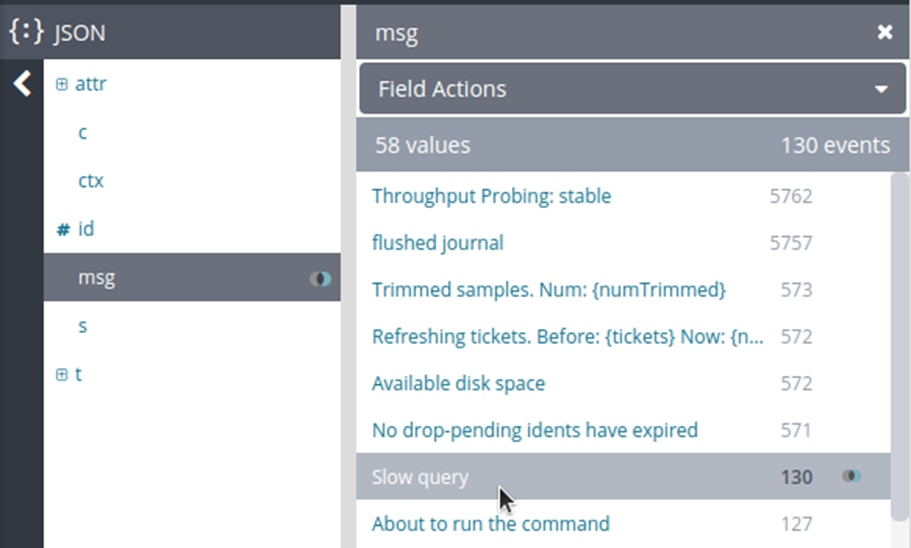
These are the resulting filter yields log entries that meet your criteria:
Advanced filtering
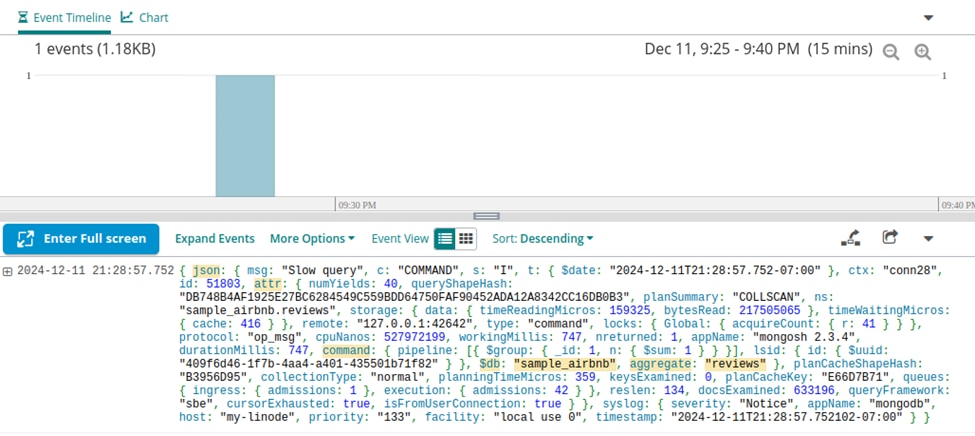
Combine multiple fields to refine your searches. For example, the following search filters log entries based on attr.command, looking for a specific $db and using the aggregate command.

Based on this filtering criteria, only one log event is found.
Time filtering
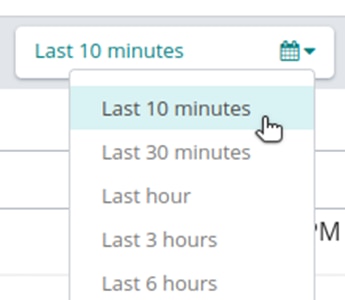
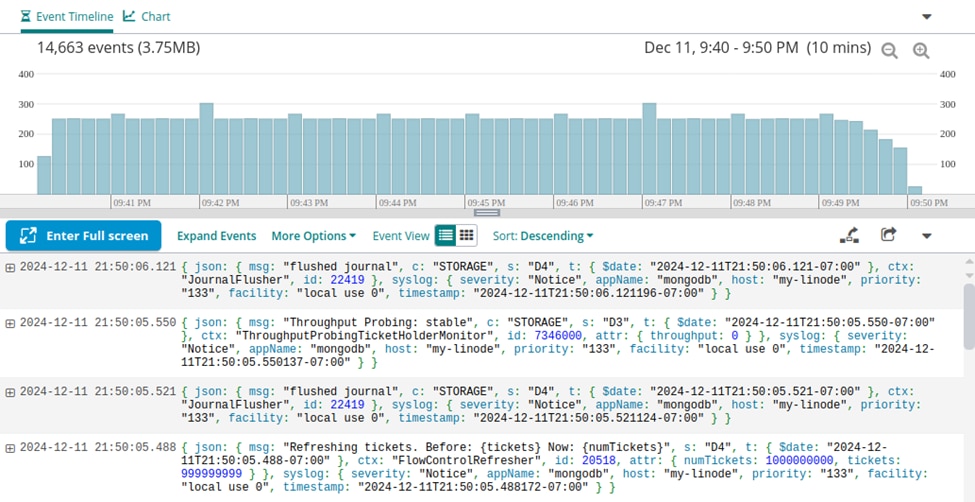
Narrow your results to specific time ranges for better context around an issue.
Visualizing logs
Now that you’re comfortable with querying, you can leverage visualization tools to extract more profound insights. This helps you stay on top of the performance of MongoDB and quickly identify potential issues.
Create dashboards
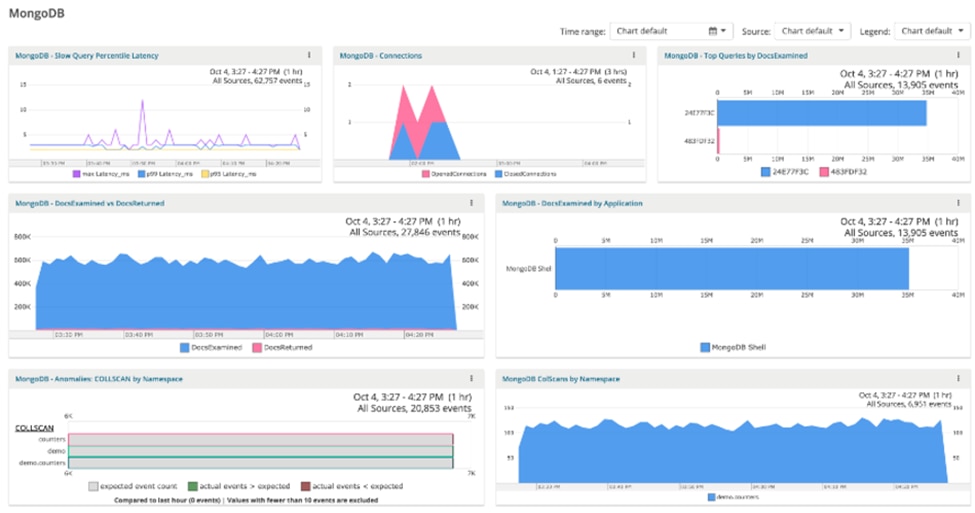
Use customizable dashboards to visually represent key metrics, such as query execution times, error rates, or connection counts.
Visualize trends
Spot trends over time, such as increased slow queries or errors, to address issues before they escalate. You can start with pre-defined visualization options, which can be tailored to MongoDB-specific log fields.
Monitoring and alerting
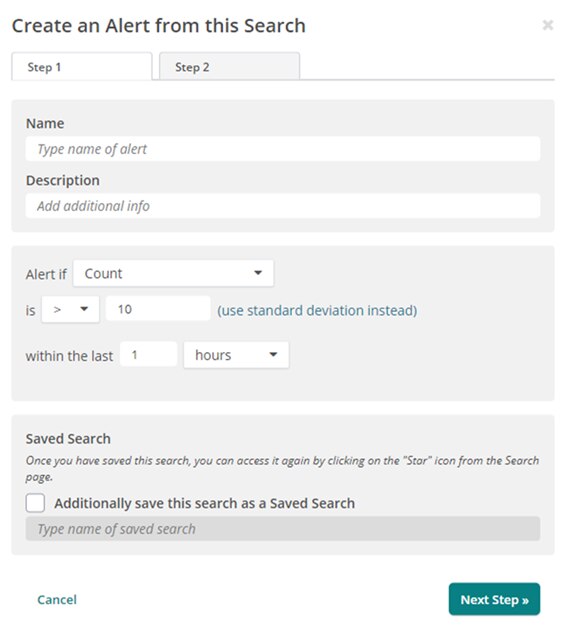
Configure alerts for critical events, such as frequent query failures or high connection counts. These notifications can be sent via email, Slack, or other integrations.
Conclusion
Centralized log management transforms how we work with MongoDB logs. Structured logging gives us clarity, and tools such as SolarWinds Loggly amplify that by providing a unified view, powerful queries, and proactive monitoring. By combining MongoDB structured logs with the capabilities of SolarWinds Loggly, we can troubleshoot faster, uncover insights, and maintain a reliable database environment.
To get the most out of your structured MongoDB logs, sign up to get started with SolarWinds Loggly for free today.
Want to dig deeper? Explore the latest insights from the Gartner® Magic Quadrant™ for Observability Platforms by clicking here.
The Loggly and SolarWinds trademarks, service marks, and logos are the exclusive property of SolarWinds Worldwide, LLC or its affiliates. All other trademarks are the property of their respective owners.
Loggly Team
