What 60,000 Customer Searches Taught Us about Logging in JSON
JSON is the most popular log type used by Loggly customers because it makes it relatively easy for you to benefit from Loggly’s automated parsing and analytics; and selfishly, it makes sense as we handle JSON better than anyone else. JSON allows you to treat your logs as a structured database on which you can easily filter and report, even if there are millions of events. Because JSON is flexible, you can add and remove fields on the fly and know that Loggly will automatically pick them up.
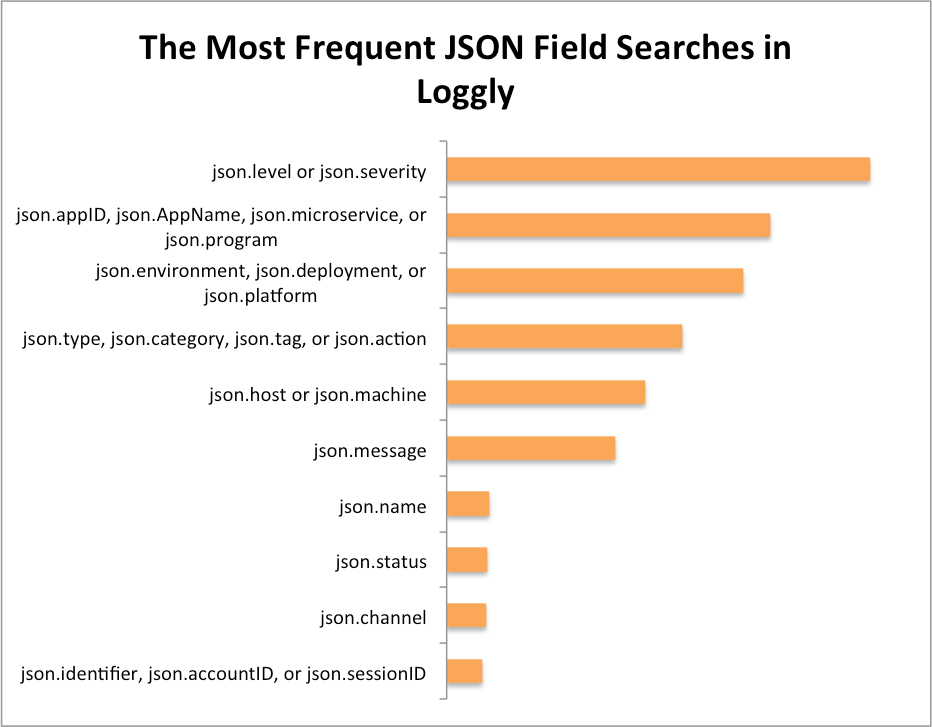
The chart below shows the JSON fields on which Loggly customers perform the highest number of searches based on a sample of over 60,000 searches.

Our customers are getting a lot of value from this data, and below I outline eight best practices that will give you more value as well.
- Include a level or severity field in your logs.
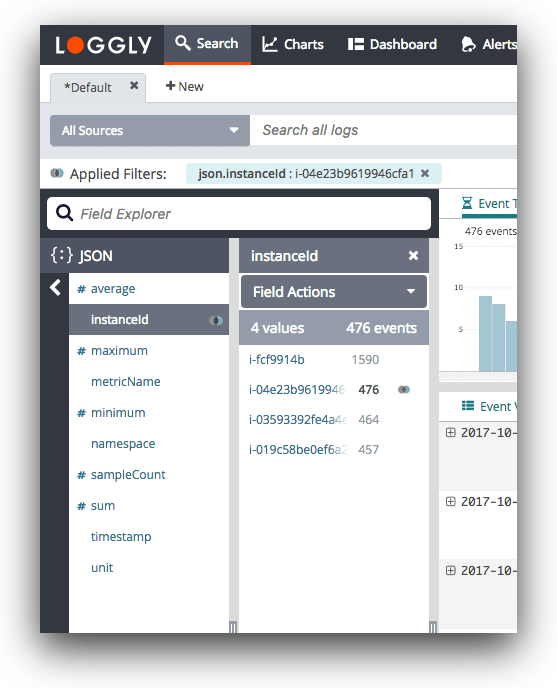
- Using json.level or json.severity allows you to instantly filter your logs to show only the events that are errors or warnings. You can filter down to your errors just by selecting the level field in Loggly Dynamic Field Explorer™, then clicking ERROR. From there, it’s much easier to see patterns in errors over time or by application through Loggly filters or trends charts.

- Using json.level or json.severity allows you to instantly filter your logs to show only the events that are errors or warnings. You can filter down to your errors just by selecting the level field in Loggly Dynamic Field Explorer™, then clicking ERROR. From there, it’s much easier to see patterns in errors over time or by application through Loggly filters or trends charts.
- Identify your apps or services.
- Often you’re investigating a single application or service, so this field helps you narrow down to the relevant logs. Additionally, as more companies have adopted microservices, each user-facing application is often comprised of several services on the backend. We have seen a big increase in searches on JSON fields that indicate the application or service name including json.AppID, json.microservice, json.program, and the like. While syslog includes a standard field for appname, if you’re using JSON over HTTP you can replicate the behavior using custom field names like these.
- Track which deployment or environment each event came from.
- You can use a field like json.deployment or json.environment to tell which logs are coming from QA, staging, and production. For example, you may not care that certain components are slow in QA, but that same level of performance can create a huge customer satisfaction hit if it’s happening on production.
- Be able to isolate specific hosts or machines.
- json.host or json.machine give you a way to identify the instance where the service is running. This could be a client host or a backend server host, although the server host is more common.If there are too many requests or errors from a given host or machine, the problem could be with that specific machine. Again, the hostname is a standard field in syslog, but if you’re using HTTP you can use a custom field name.
- Put unstructured text in an easily searched field such as json.message.
- Many of Loggly’s libraries put the unstructured portion of your logs into the json.message field. That’s why this field is among the most commonly searched among Loggly customers.
- Group and filter events by type, category, name, or other criteria.
- It’s often useful to label your logs with a specific type or category so that you can filter down to that type when investigating an issue. In our own service, Loggly uses json.action to track logs related to a user action such as viewing a page or clicking on a search. If we only care about user actions, we can filter to just see those events. Other customers use json.category, json.name, or json.type in a similar fashion. In addition, json.tags can be used to mimic the behavior of Loggly tags, except from within the event itself. This lets you add them to trend views and even archive to Amazon S3 when you no longer want to retain it in Loggly.
- Find the logs for each customer.
- You may find it useful to include an account ID or username as a way to diagnose customer-specific problems. If your support team gets a tweet or email from a customer, they can quickly isolate the logs for that customer to see exactly what happened.
- Use your logs for more than troubleshooting.
- Log data has traditionally stayed in the realm of sysadmins and developers, but the reality is that it can play a valuable role in monitoring and optimization across the business. For example, a number of Loggly customers use a field like json.channel to attribute revenue to different marketing channels. In essence, you’re treating Loggly as a real-time analytics solution that can scale to handle large amounts of traffic. (You can read about our customer Citymaps and revenue attribution here.)
Start Logging in JSON Now
The JSON fields I discussed above are popular for good reason: They hold the keys to recording the right data for solving many operational problems and for organizing your navigable, structured data. This helps you answer questions faster. It also allows you to be more proactive with log management, so you’re solving problems before they affect customers. If you’re not already logging in JSON, I hope you have walked away from this post with some good reasons to start now!
Editor’s note: This post, originally published in September 2014, has been updated with new data.
The Loggly and SolarWinds trademarks, service marks, and logos are the exclusive property of SolarWinds Worldwide, LLC or its affiliates. All other trademarks are the property of their respective owners.
Jason Skowronski
