Technical Resources
Educational Resources
APM Integrated Experience
Connect with Us
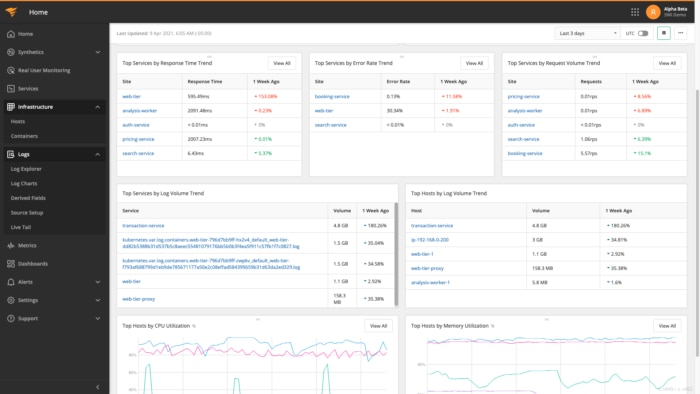
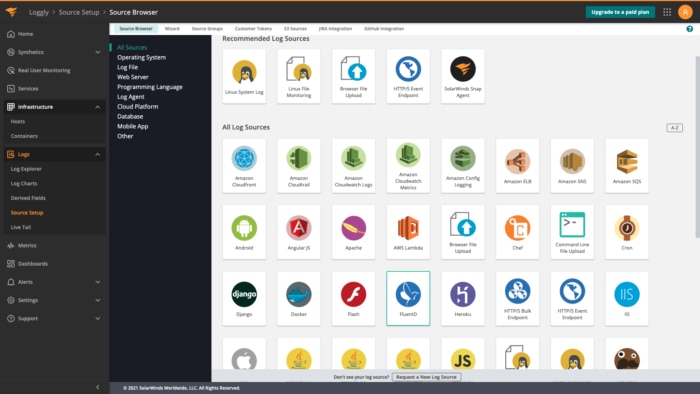
SolarWinds Loggly offers cloud-based log aggregation and analytics to help organizations solve their logging challenges. In addition to HAProxy logs, Loggly accepts a wide range of logs from different servers, operating systems, applications, and languages.
With all your logs in one place, it’s easier to correlate different logs and get to the root cause of application and infrastructure issues. Unlike other logging tools, Loggly has an agentless architecture. This makes it easier to send logs to Loggly using simple scripts over syslog or using log sources such as rsyslog, Fluentd, Docker, and more. Syslog is the preferred method for sending HAProxy logs to Loggly.
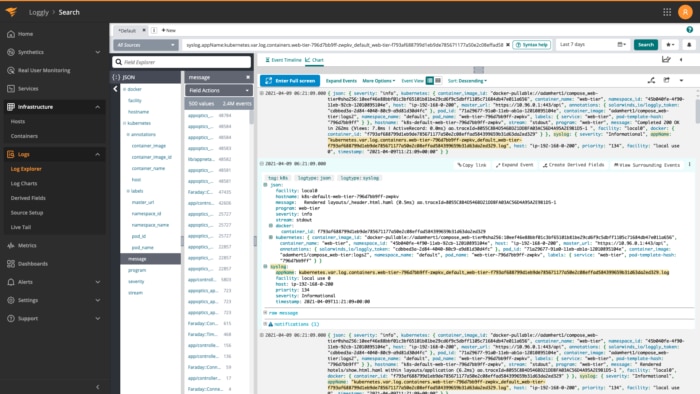
Unlike other methods where the configuration of an HAProxy log parser is needed to analyze logs, Loggly offers automated analysis. This allows it to offer near-instant search results for your queries.
As Loggly is built for simplicity and scale, it allows you to run full-text searches. Additionally, it lets you run searches over a particular range and field using Booleans without requiring any proprietary query language. Loggly also helps you gain useful insight into your data in a seamless manner with the Dynamic Field Explorer™, which offers a structured summary of parsed logs. With this explorer, you can click and browse through the logs without using multiple commands.
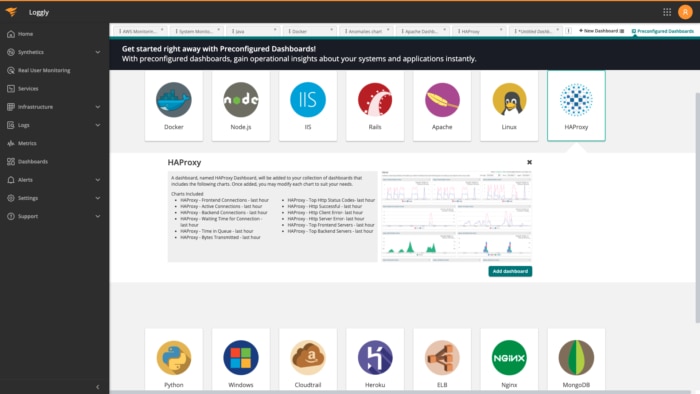
Loggly makes it easier to find anomalies and hidden patterns in your HAProxy server logs with its integrated charts and dashboard. You can visualize search results using various types of charts, which can be grouped together to form a dashboard.
You can share dashboards with your team or download them in the form of PNG images for reporting. Furthermore, Loggly integrates with all popular notification services for alerts. For your application logs, you can leverage the Loggly GitHub integration, which links logs to the particular line of code in the SCM. Loggly also integrates with Jira, making it possible to raise tickets without leaving the Loggly window. These integrations allow your team to collaborate and resolve issues smoothly.
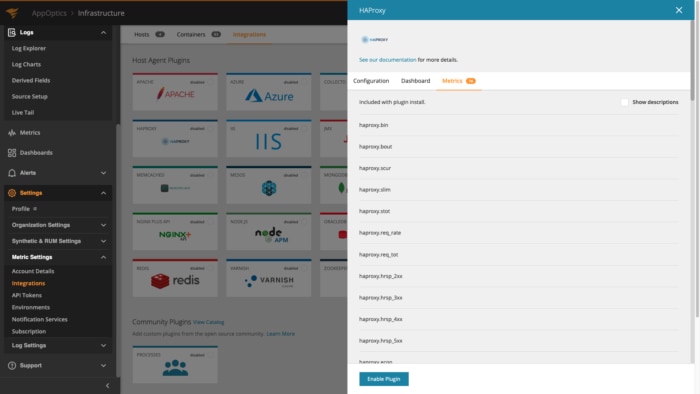
AppOptics provides deep insight into system performance and health and identifies potential issues. The tool can monitor 80+ HAProxy-specific metrics and key load balancer metrics to identify the root cause of a system performance issue.
With its custom dashboards, clear graphs, and trace summaries, you can get a holistic view of slow response times, latency, and issues. Utilize the smart alerting features in AppOptics to get quick notifications about slowdowns and potential issues before they affect the end-user experience.
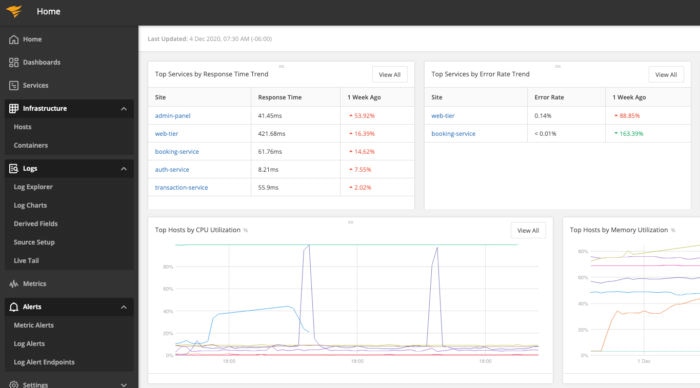
Seamlessly integrate AppOptics with Loggly to dive deeper into HAProxy insights. Get elaborate reports, logs, traces, and structured summaries to speed up the troubleshooting process. Leverage multiple integrations for both tools to find hidden patterns capable of helping in anomaly detection.
These application performance management (APM) tools provide robust features to centralize and parse logs, simplify log search and filtering, and perform functions like live code profiling and exception tracking to save time and improve efficiency.