Technical Resources
Educational Resources
APM Integrated Experience
Connect with Us
Generally, teams need to get logs from all the applications running on their Kubernetes cluster in one place for better monitoring, better analysis, and complete visibility into changes made in the Kubernetes cluster. However, using “kubectl” to tail logs is complex and not scalable for a high volume of logs. This process is also insecure, as it needs direct access to the cluster.
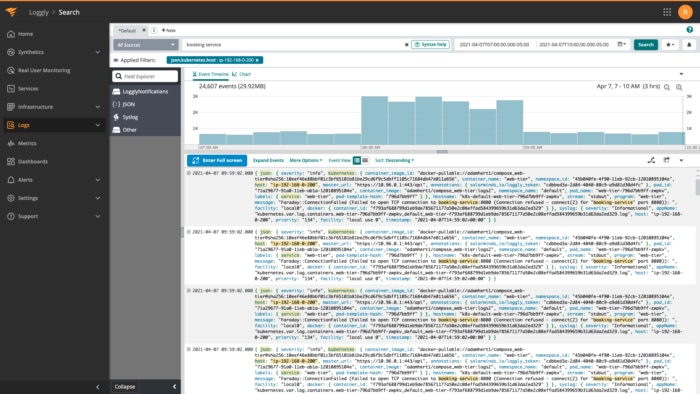
To solve this, Loggly lets you monitor your Kubernetes cluster through a centralized solution by aggregating all your logs in one place and making them accessible through a web interface. It also allows you to control access according to your needs or organizational policies, making Kubernetes cluster monitoring effective.
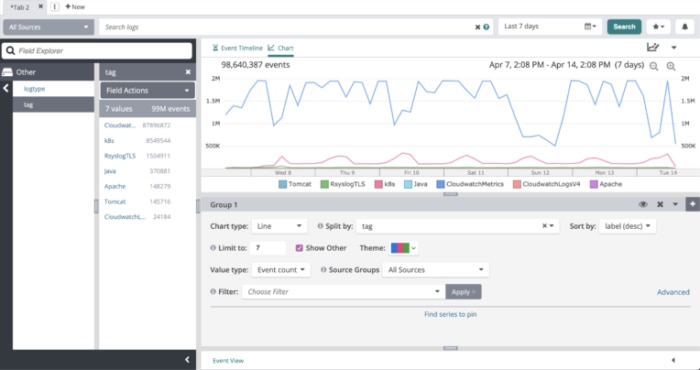
Setting up the ELK Stack requires complex configuration. Furthermore, logs can multiply at a rapid pace in a cluster, and teams can struggle to scale the ELK Stack for better searching and monitoring. Loggly comes in handy in such scenarios with advanced features like the Dynamic Field Explorer™, which allows you to drill down into specific components for faster troubleshooting.
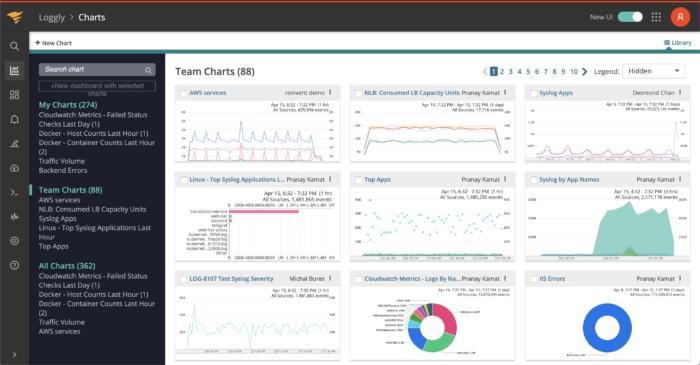
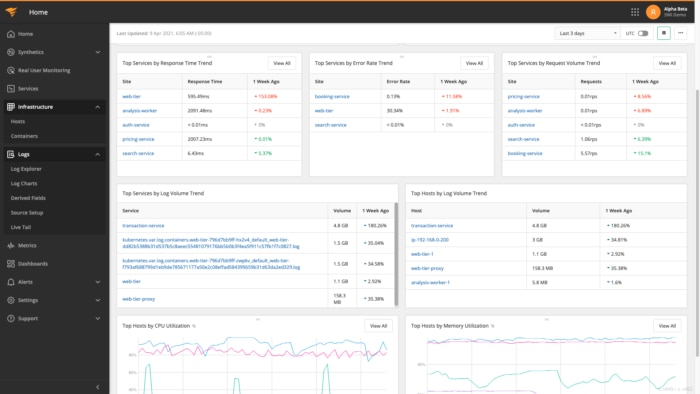
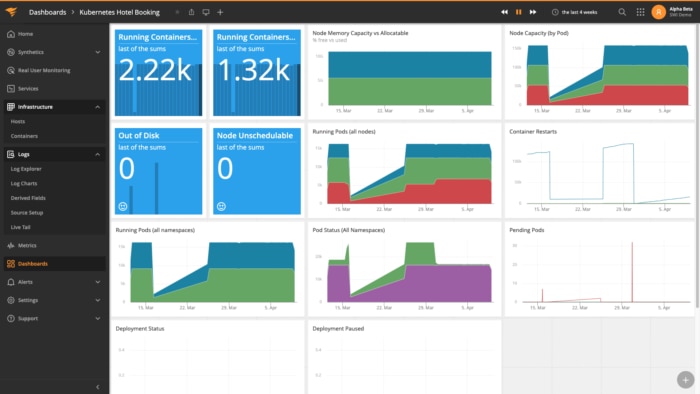
For effective Kubernetes monitoring, Loggly provides high-level charts and dashboards. You can also share these dashboards with other team members for quicker troubleshooting and set alerts using Loggly to detect potential issues before they occur. Such proactive alerting reduces customer impact and gives you more time to run your applications instead of taking care of troubleshooting issues.
You can use Loggly anomaly detection to track exceptions faster and take corrective action. You can also integrate Loggly with tools like GitHub, Jira, and more for easy collaboration.
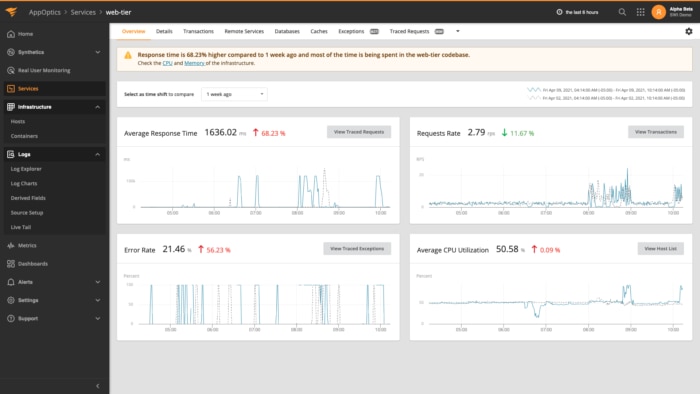
AppOptics is a software as a service (SaaS)-based monitoring solution for application and infrastructure analysis. With its powerful distributed tracing feature, AppOptics monitors thousands of infrastructure and application metrics, including containers, Kubernetes deployments, cluster, pods, nodes, events, and more to provide detailed information on application health and performance issues.
The tool provides real-time time series metrics and distributed traces designed to help identify performance problems, and this allows for fast and accurate troubleshooting of Kubernetes resources and the applications running on them. The intuitive dashboards in AppOptics help you gain visibility into application components and enable automated alerting as soon as a threshold has been reached and a potential performance problem is discovered.
You can use Loggly and AppOptics together to maximize the efficiency of Kubernetes clusters, minimize downtime, and keep your network operating at optimum levels. These application performance management (APM) tools offer centralized dashboards to effectively monitor and analyze Kubernetes logs.
These APM tools also offer features like live code profiling and exception tracking to help you drill down into the root cause of a slow application or transaction. The dynamic union of both tools helps streamline application performance through anomaly detection and efficient management of Kubernetes logs.