Technical Resources
Educational Resources
APM Integrated Experience
Connect with Us


SolarWinds Loggly offers a cloud-based log analytics and aggregation platform to help in real-time Linux log monitoring. Loggly accepts all kinds of structured and unstructured logs, so you can use this platform to centrally manage all your infrastructure and application logs for unified monitoring and faster analysis.
Loggly offers both an agentless or agent-based option, allowing you to choose the configuration that works best for the specific system and your organization. An easy option for Linux logs is to send them to Loggly using the syslog daemon. For other systems, there are short scripts you can use to collect logs from different sources and send them to Loggly. Further, Loggly allows you to automatically archive your older logs on AWS S3 buckets for compliance purposes

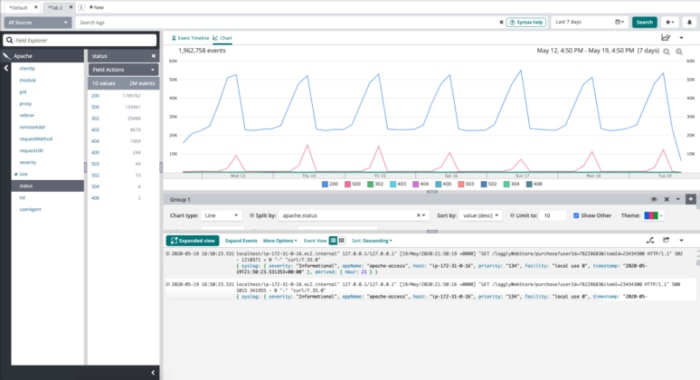
Loggly offers a powerful search that was designed to perform well across massive log volumes and long time periods. Loggly parses incoming logs and automatically presents your log data in a structured manner for quicker searching. You can explore the relationship between different events in the dynamic field explorer which allows you to interactively click and browse through fields.
Loggly also makes it possible to view all related events around a critical event with its surround search feature. With these and many other features, Loggly significantly reduces your time to resolve issues and makes troubleshooting seamless.

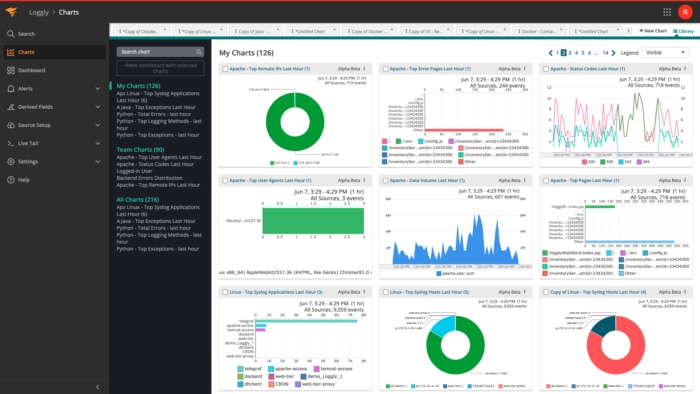
Loggly helps you save time and effort in configuring multiple tools for log visualization. You can use a pre-configured dashboard for Linux monitoring, which includes charts that pull key performance and usage-related metrics from your logs. All these charts can be synced to a common time frame with a single click. You can also customize the dashboard to suit your specific monitoring requirements.
Loggly allows you to compare charts over a period with its timeshift feature. With easy visualization, you can spot important trends and detect troublesome patterns in real time. You can share the dashboard with your team and work together to resolve issues faster.

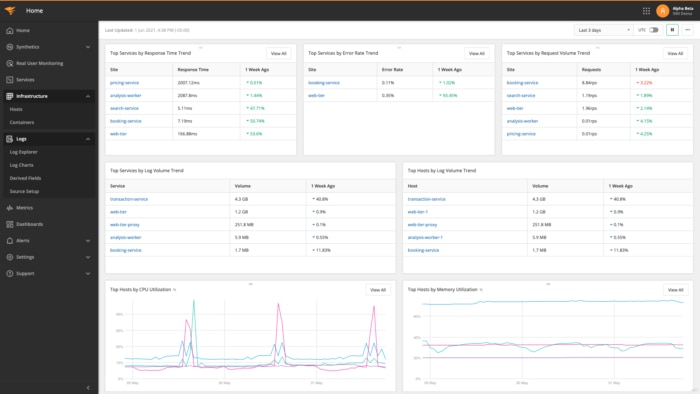
Loggly integrates easily with Solarwinds AppOptics to provide a full stack view of Linux server health and performance. AppOptics collects metrics from servers and applications across your environment. It brings this data together to provides rich visualizations that make it easy to spot issues and powerful troubleshooting tools like traces and root cause summaries that can help you troubleshoot issues faster.
Together, AppOptics and Loggly combine to provide full-stack visibility from the application level down to the line of code. You can easily move from a dashboard that shows a slowdown in performance into a trace that visually represents the spans, and with a click dive into the specific log events. This visualization and tight integration enables quick identification of hot spots and reduces mean time to resolution. Used to together, Loggly and AppOptics automate the monitoring and logging of Linux applications and can help you identify issues early.